Sunday, February 26, 2017

2/26/2017: daily stock pick Nordstrom (JWN)

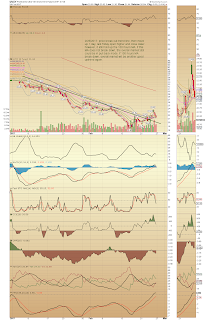
Today's one of my system pick is Nordstrom (JWN). Followings are some technical characters:


  • RSI move up and point up
  • MACD and PMO still golden cross up
  • BB squeezed so much that ready for expansion
  • price box [41,46] ready to break out
  • price right under 50 days MA and get retrace back from 200 days MA last Friday (2/24/2017)


In summary, most technical indicators point to the stock price will shoot up. However, the 50 days MA and 200 days MA are still resistance. Is this a concern? My personal opinion is "the 50 days and 200 days MA resistances are a take away , a contrarian signal". How to handle this trade? 

  • Buy after break out 50 days and 200 days MA, then next is the upside target: gap fill around $55. 
  • Buy between 45~46, wait for break out, stop below 42. upside target same around gap fill $55.
My personal opinion is not for investment purpose, it is only for education and illustration.

Saturday, February 25, 2017

2/25/2017: using VIX related instrument to evaluate the market possible move

UVXY is short term future ETF which can measure the current market's volatility. Sinbce 2/15, UVXY and overall market both climbs up. On 2/22, the sp500 spent a weak trading session. On 2/23, the  sp500 initially had a good sell off, then recover most of them. Last Friday, sp500 open lower and close higher. Following are some technical characters of UVXY:


  • break out down trend trendline, so price enjoyed 2 days move up
  • Last Friday's close right on 100 hours MA


From bigger time frame daily chart, we can have some clues for trading strategy.


  • last September market big pull back UVXY high at 50 days MA
  • last November market big pull back UVXY high at 55 days EMA
  • sp500 make lower low from September to Nov, UVXY made lower high.


What we can get from UVXY daily chart is that UVXY is momentum play, not a hold play. furthermore, UVXY higher high to lower high: (130 to 104.2) down 19.2% and sp500 from high to low: (2187.87 to 2083.79) down 4.76%. So should we worry about UVXY shoot up for an equity buyer? The answer is No. Short UVXY around 50 days MA/55 days EMA has much higher gain than holding a long equity loss.

The short term overall market direction is the most concern for every investor or trader since the index come to a historical high. My personal opinion is that if UVXY can hold 100 hours MA, the overall market has much higher probability to pull back. However, if UVXY break down 100 hours MA, the overall market will enjoy another move up to new high.  

My personal opinion is not for any investment purpose, it is for education and illustration.

Thursday, February 23, 2017

2/23/2017: retail ETF (XRT) update

Retail ETF XRT got hammered today. Lots of people who owned shares asked for my opinion. I have a position with OTM June $50 call at $0.12 per contract. (a small bet, either big win or a negligible loss) . Let's look at some technical characters:


  • The monthly chart is always used for my favorite long term bet because long term decision need long term trend follower
  • price hold up 50 months MA since Jan 2016 until now. This long term MA get very crucial now. If at the end of this Feb, price cannot hold up, it is indeed a big trouble for this popular ETF.
  • the monthly chart also forms a big triangle, break down or beak out
  • the monthly chart also forms a smaller bull flag (too small, I did not draw it) 


So what is the take? My personal opinion is that since 2016 this important 50 months MA touched so many times and held up, this time it should hold up again. The reason is simple, the overall big market is still in a bull run market, this particular ETF should not be left out. Again, my personal opinion should not be an advice for any investment purpose. 

Wednesday, February 22, 2017

2/22/2017: material ETF (XLB) update

The XLB has quite some weighting on chemicals such as DuPon or Dow chemicals who made break out recently. This ETF should be watched for break run also.


  • chart shape looks like a bowl 
  • CCI turn around up
  • RSI climbs higher


As long as price hold up $51, the short term uptrend is still. Buy entry around 52 is a good deal, the upside target is around 55.

2/22/2017: oil ETF (XOP) and stock ATVI update

Although the crude perform pretty decently, the oil exploration and production ETF (XOP) does not perform well. The technical characters are following:


  • MACD down cross
  • RSI roll over, pointing down
  • price in a down channel
The weak price action and weak technical indicators mean the short term price should go down more. Where will the price stop the bleeding? The most probably level is the confluence between 200 days MA (50 week MA) and the down channel lower bound. If price can bounce from there, the stock may resume another uptrend. the buy level is around the confluence between 200 days MA and down channel lower bound.

The update of stock ATVI is  following:

  • RSI a little bit overbought
  • price level is 45.5 is resistance, if take out 45.5 ,it will challenge the high again
  • if level support 44.5 is not hold, the price may retrace to level 43, if 43 not hold, 40.5 is next support

In summary, any support level get hold, it can be a buy level, the fundamental of the stock is good, buy dip is the strategy.

2/22/2017: sp500 key levels update

A series of important levels to watch for trading decision(especially for the downside trade).


  • current high: 2366.71
  • recent consolidation low: 2358
  • last gap start level: 2355
  • last gap up gap level: 2351.22
  • last consolidation low: 2339.5
  • The 2/13 consolidation box high: 2330.5, box low: 2321.5
  • 2/13 gap up gap level: 2316
  • 2/10 gap up gap level: 2307
  • break out level: 2300.99


All these levels are key levels for the downside trade. Following are some examples:

  • if price break down 2358, it will go to 2355, if break down 2355, it will go to 2351.22
  • if price break out 2366.71, the measured move will be 2374.71
Remember all levels now act as supports, later can act as resistances if price below them. If any support gets hold up, it can be a buy level for upside trade; if any resistance gets hold up, it can be a short level for downside trade. 

Tuesday, February 21, 2017

2/21/2017: sp500 update

Since 2315 gap up, sp500 had already run up to 2351.16 with 36.16 points gain. The long weekend E-mini sp500 was climbing higher with low volume squeeze up (now in 2153 area). It looks like sp500 will make another gap up this morning (2/21/2017).


  • The technical indicators still look strong
  • No sell or short signal still by daily signal.
  • watch for [2339,2340] area support, if this area no hold, it opens up down side momentum to 2330, and further down to gap fill 2315
  • The upside watch for 2350 break out with 10 points measured move to 2360.
  • The trading range most probably will be [2340, 2360].


2/20/2017: daily stock pick Credit Suisse (CS)

The first stock selected is credit suisse (CS). The stock in a good uptrend for more than 8 monthos since bottom out in last July. followings are some technical characters:


  • uptrend trend line not broken since last July
  • MACD golden cross
  • RSI move up
  • all short terms' MAs are underneath supports


In summary, the stock is in relatively long term uptrend, there is still room to go up with financial sector. The buy entry is [15.15,15.3], the midterm target is around 19 as strong resistance (weekly chart can tell clearly).

Second stock selected is At&T(T). Will continue.....


Monday, February 20, 2017

2/20/2017: stock update United Healthcare (UNH) and (GS)

First the stock of United healthcare is discussed here. The stock price got punished last Friday (2/17/2017) due to DOJ accusation of medicare overcharge. Following are some observations of current price setup due to last Friday price  drop:


  • price still in the box [156, 164]
  • price hold up box low on last Friday
  • the open gap at 163.6


The personal opinion here is buy the bad news. As long as the bad news is not associated with the business development, the stock price will recover eventually. The recommendation is following:

  • buy the low bound of the box around $156 for half position
  • add next half long in case price down to gap fill at 152.25
  • the midterm upside target is still measured move $172.

Second, the stock of Goldman Sachs is discussed. GS is the leader in financial sector. its price action is always in the center of attention for further trading opportunity or long term investment. 

  • The price recently broke out price box [230, 245]
  • and back tested 247.11 and hold
  • within next month or 2 the upside price target is around measured move $260 (unless the price move down back into the box [230, 245], otherwise upside target will achieve)


  • GS monthly chart wedge or triangle break out 
  • the measured move upside target is around $290~$300.


2/20/2017: potential earning option play (Monster Beverage)

One of stock: Monster beverage (MNST) was identified by me that it is a good potential earning play. There are several technical characters to make the earning play:


  • Bollingar band squeeze hard to be ready for expansion
  • MACD still keep golden cross
  • CMF cross up from under 0 (positive money flow)
  • MFI keep growing higher
  • slow STO ready to move up.
  • last 3 and half months trading range [40.6, 46.3]
  • last Nov post ER price drop by around $6 (46.6~40.6) within 2 weeks
  • last July posr ER price drop by around $5 (53~47) within a month and half
  • last April post ER price up by around $8 (42~51) within 2 weeks     

The option plays were summarized as following:
  1. an unbiased straddle play: March 17th $43.33 straddle middle value is $3.22, it is aligned to the trading range top and bottom. Buy this straddle to expect the price break out or break down the trading range with $5~$6 price move (based on last 3 quarters post ER price move). Even the post-ER price cannot break out or down the range, it will still touch the range extreme to keep almost no loss. 
    • An aggressive variation of this straddle is a straddle spread: buy march 17th call spread [ 46.67, 48.33] with $0.14 debit and buy march 17th put spread [40, 38.33] with $0.2 debit. The total cost is $0.34 debit, the potential gain is $1.66-$0.34 = $1.32 per contract. 
  2. Based on the positive technical indicators and money flow, the biased trade  is post-ER price up. 
    • aggressive one is a synthetic call spread: buy march 17th call spread [ 46.67, 48.33] with $0.28 debit, sell march 17th put spread [40, 38.33] with $0.2 credit. The trade comes out with total debit $0.08. If the upside trade is successful, the pay out ratio is really high 1.6/0.08=20. if not, lose $0.08 per contract as long as price hold 40 on March 17th expiration.

My personal opinion is for the unbiased trade: the straddle play.


Friday, February 17, 2017

2/16/2017: stock pick Cirrus (CRUS)

The post  earning's stock price of audio chipset provider for apple: Cirrus (CRUS)   got pretty good dent. However, recent 2 trading sessions, price started to climb up back. Following are some technical characters of the chart:


  • The gap up from last August short term trend line still hold up
  • all STOs bottomed up
  • RSIs pointed up
  • MACD energy bar bottom up


In summary: the recommendation is buy, the buy entry: 54~55, upside target: 57 or gap fill at 62, stop below 52.8 or the trend line.

Tuesday, February 14, 2017

2/14/2017: stock pick (ABBV)

The stock ABBV looks like a buy at current set up:


  • MACD ready to get golden cross
  • price touched the lower trend line of the triangle set up for 2nd time, it bounced up
  • The BB squeezed and is ready to expand
  • the next move should try the high trend line of triangle
  • buy entry 60.5~61, stop below 60
  • price target higher bound of triangle or 66 after breakout 


Monday, February 13, 2017

2/13/2017: FANG update

First is netflix (NFLX). The stock price of netflix still move up relentless recently. Today the stock price showed some weakness by selling off at the high of the day and close at the low of the day. The possible next move within next several trading sessions will be characterized as following:


  • On 2/9/2017, the price break out the box [137.5, 142.5], the upside measured move target is around $147.5
  • The current right on the rising wedge lower trend line, if it hold, the price may climb within the wedge and toward $147.5
  • if the price does not hold the lower trend line of rising wedge, it may comes to $142.5 support and touch another the lower trend line of lower rising wedge, then move back up  


Second let's look at Amazon (AMZN). The small top trend line was formed. If the price can break it out, the measured target move is around $880 (a nice Chinese style lucky number).


  • 3 support levels need to be watched $827.5, $820, $800
  • Take these 3 support as buy entries (if you do not have the shares yet)


2/13/2017: market update (Sp500)

The sp500 index today make continuous gap up today and close at 2328.25. With today's gap up, it had 3 continuous gaps in last trading days. It is extremely strong market, however, today's volume is light. Can the market make the bull magic tomorrow again? It is not a sure thing. But the technical indicators showed more upside ahead still:


  • MACD and PMO in golden cross
  • Sp500 bullish percentage index move back up again and stand above EMA 20
  • AAII sentiment back up to positive
  • ROC still point up and above its own EMA 20 


In summary, no matter tomorrow how the market will perform, the more upside is still highly possible. The upside ARC resistance trend line 2340 should be tested in next several trading sessions.

Sunday, February 12, 2017

2/12/2017: gold/silver index update and bull trend forecast

The following chart is the gold/silver index vs US dollar chart. Since the index bottom out in Jan 2016, its price move back up violently. It seems the bull trend has already finished the wave 1 up and wave 2 down, is on the way of wave 3 up. The following projection is based on the bull trend (there are definitively some cases that the bull trend need to be scratched)


  • Assume this is a new uptrend with five waves up
  • wave 1: [0.385 , 1.199] (finished)
  • wave 2: [1.199, 0.696] (right on 0.382 fib, finished)
  • wave 3 is projected  [0.696, 1.51] (1.618 fib) or  [0.696, 2.01] (2.618 fib)
  • wave 4's projection is better to wait for wave 3's finish
  • same for wave 5's projection 
In what scenario, the bull trend should be scratched?
  • The price break down 0.696, the wave 3 is invalid, then it may be still in the corrective wave of previous down trend from 2011's top.
  • The price break down 0.385, it is definitely sill in the corrective wave of previous down trend from 2011's top.


In summary, this future price projection is based on Elliott wave pattern. So far the upo wave 1 and corrective wave 2 are line up for fib retracement. Let's see how the projected 3rd wave up perform. Usually the 3rd wave up is strongest thrust wave. However, the up wave has smaller sub-waves, do not expect up wave will go up straightly. There will be corrective waves within 3rd wave up. The key is can this 3rd wave up take out wave 1 high 1.199. If not, this bull trend theory is invalid. If yes, stay with your trade on course for the target 1.51 or 2.01. When the 3rd hit the target, wave 4 projection will be updated.  

2/12/2017: ETFs holdings since trump election

Following is a ETF list I collected and owned after trump got elected. I still hold some of these ETFs. The update here is due to friend's request (shared in wechat group in last November, but hard to keep the record). 

  • Trump's rally, such as construction sector: ITB, PKB; defense sectors: ITA, XAR; financial sector: XLF, KIE; industrial metal sector: SLX, JJC; mining sector: XME and energy sector: XLE. 
  • Economy leading sector: semiconductor sector: XSD (small/mid cap), SMH (mid/big cap).
  • Favorite sector:  biotech sector: XBI and IBB ( I still believe the biotech is the future technology who can make break through like internet break through in 1990 era). 
  • Nice to have sector: managed healthcare: IHF, medical device: IHI
  • Last is the index ETFs: IWM, SPY, DIA, QQQ
Today I will update one of sector ETF: XAR. I still own it since I bought it around $64 at end of last December. Following are current some technical characters and high possible next move:

  • on 12/6/2016, the top divergence is detected and wait for pull back to entry
  • on  2/11/2017, the price action break out the box range [63.2, 66.5]
  • MACD and PMO golden cross happened in early Feb
  • the break out price target is around $70.
  • buyers can buy any pull back to $66~$66.5

Saturday, February 11, 2017

2/11/2017: market update (index ETF update)

The small cap ETF IWM was consolidated within a box for 8 weeks so far. It is ready for break out. Following are some present technical characters of the chart:


  • RSI break out down trend line
  • price comes into the strong ichimoku cloud support and bounce up to the high bound of box
  • MACD daily golden cross
  • The BB again squeezed very much for another expansion
  • With current strong technical indicators, the price has high probability to break out
  • the box break out target is $142~$143


The Dow Jones Industrial average ETF: DIA broke out last Thursday and continued moving up last Friday. The momentum is pretty strong. The technical indicators have following characters:

  • RSI break out down trend line
  • MACD daily golden cross
  • The BB again squeezed very much for another expansion
  • With current strong technical indicators, the price most probably will move up within the rising wedge
  • the end of rising wedge price target is around $208

The Sp500 ETF: SPY has same technical patterns as others' index ETF. 
  • The rising wedge price target is around 234
  • It does not mean the price only can get to 234, then will top out, it only tells the pridicatable pattern price target. The real price can be higher.

Thursday, February 9, 2017

2/9/2017: daily stock pick (Northrop Grumman)

The defense sector bottomed out since last Tuesday and continue the upward movement. One of defense player: Nothrop Grumman (NOC) stands out as a good potential buying opportunity.


  • technical indicators: MACD , PMO all are positive
  • all short term MAs' confluence are beneath as strong support
  • only 50 days MA as resistance
  • buying entry: 232.5~235
  • upside target: 240, 245, 250.
  • stop loss: below 227.5.


In summary, the 50 days MA resistance is relatively easy to be taken out. The upside target: 240, 25, and 250. If break out 250, we will revisit it for future target.

2/9/2017: Sp500 update

Today Sp500 index stealthily break out 2300 and touched top trend line of wedge at 2311.08 and reverse back a little bit. It looks like a short squeeze price action market. The possible next day price action could be:


  • back test 2300 break out level, then reverse back up to continue the uptrend
  • back test 2295 gap fill area, then reverse back up to continue the uptrend
  • There is very very small possibility that the index will break down 2290 area to fill the gap at 2280


In summary, the odds is still with the long side, buy dip is still the action to do for 2/10/2017. Buy level is 2300 or 2295 gap fill. 

Wednesday, February 8, 2017

2/8/2017: Nvidia update before ER

The 2016 hottest stock finally comes to the first quarter earning report. Lots of traders, investors start to chime in different opinions or trading plans for this earning report. I am going to do some analysis and possible price action forecast for post earning report.


  • The post-ER price gap up case is not discussed here. However, it is discussed here in details. The gap up price target is around $128~$130 based on option chain data.  
  • The potential daily RSI top divergence is happening
  • The option chain data showed $10 move each side (up/down)
  • Based on so stretched price push up before earning, my gut feeling is the post-earning price will go down, but the uptrend will still hold.
  • It will form a cup and handle shape to run higher again. The post-ER price action will form the handle.
  • Where the price will hold up if price really comes down after earning report. 
    • $118-$10 =$108 
    • 2 price levels could be the supports: $110, or $105


In summary, this analysis is for those who are not holding the stock of Nvidia, but ready to scoop up the shares. The post-ER gap case is not recommended to chase (I always play gap fill, then relaunch). If the price action match the analysis here, the buy entry is $105 or $110. Then wait for the formation of the handle of the cup and handle, the price will relaunch higher to target price $140

2/8/2017: Sp500 E-mini (ES), cash index update

Today ES tested 2281 low and reverse back to 2292 high , then close at 2291. The price is still in back and fill mode to fill the break out area from 2275 to 2285. The price action is pretty neutral.


  • The VPOC is still at 2288.5 same as that of yesterday (2/7/2017)
  • The value low is at 2286 same as that of uesterday (2/7/2017)
  • The value high is at 2291 one point lower than that of yesterday (2/7/2017)
  • The volume profile is a P shape profile with long tail at 2281, if tomorrow price can take out value high 2291, 2295 is the first target, then 2299.
  • Buyer still can buy at level 2275, 2280 if one of them hold
  • Seller still can short at high 2295 or short below 2288.


let's look at cash index. The price test 2285 low and reverse back to 2296 high, then close at 2294.67. Everything is still in the range (2285~2296), within the uptrend channel. The possible price action tomorrow:


  • test 2280 low(gap fill), then reverse back up
  • test 2285 low again then reverse back up
  • test 2300 high then reverse back down  


Tuesday, February 7, 2017

2/7/2017: (noble drilling corporation) stock analysis

The energy sector got weaker along with recent weak crude price. Noble drilling corporation (NE) is one of the energy stocks some friends plan to own. I made some analysis as following:


  • price runs within a triangle, the price touched lower trend line
  • technical indicators are still weak: MACD line still under signal line, price momentum oscillator line  also under signal line, RSI under 50 neutral
  • the Bollingar band is squeezed very narrow, is ready to expand (price movement can be up or down)
  • price can break either side of triangle with big upside move or downside move
  • upside target is around 8.3
  • downside support: $6, $5.25, and $4.5
  • based on weak technical indicators and weak crude current price, the downside has higher probability (but lower probability event indeed happens)


In summary, there is no recommendation on this stock. Only analysis is provided.

2/7/2017: stock picks and update

Today's one of hot stock definitely is Advanced Micro Device (AMD). The post earning continuous push ups made price high at $14.27, then reverse back to give back all gain to close lower at $13.29. This price action showed the RSI daily divergence. If tomorrow price continue to pull back, the divergence start to work. Note, with this divergence, there is no chase even the price does not immediately pull back.


  • 2 buy levels: $12.5: the break out level, $11.5: one of transaction congestion area
  • upside target is measured move $15.42


There are two recommendations are following. They are both fiber optics stocks. The first one is Finisar (FNSR). The price comes out from short term MAs resistance and get to 50 days MA. All technical indicators run positively. I believe the price will overcome this resistance without much effort.
  • buy entry 30~30.8
  • upside target : 33, 35, 37 

The second stock is LITE. The price shoot up with huge buying volume after earning post. All technical indicators are positive. All short term MAs are lined up for support.
  • Buy entry 39~40
  • upside target the top trend line around 43~44. 


In summary, no chase on AMD since the RSI daily top divergence. Buying dip on AMD is still good. Lite and FNSR are good buys. It even is ok to chase with small premium.

Sunday, February 5, 2017

2/5/2017: market update (sp500 and gold)

Last Friday's NFP pop the sp500 index back to 2295~2300 range with bottom island reversal. What could be next move is most people are concentrating on. The following chart is a bullish percentage index I used to follow the market (one of technical indicators). Although his index started negative divergence since middle of last December, the market only has a very shallow pull back from 2300 to 2267.21. What will be the next move? Some analysis is following:

  • MACD still cross down, it means this index is still weak and hints the sp500 index upward momentum get weaker.
  • Both slow STO and fast STO are oversold, there is a need for the bounce
  • The most important thing is that this index get support at 50 days MA and start to bounce, further more all other short terms MAs are still above 50 days MA (This is different from last September's market correction). All these short terms MAs (4 EMA, 8 EMA, 13 EMA, 34 EMA) start to point flat.   


 http://schrts.co/5qcQYt


In summary, if this index indeed keep bouncing from 50 days MA and cross up all short term MAs, the sp500 index will still has room to go up.

Another breadth indicator can predict the market turn (big turn, not small turn). The chart of SP500 percent of stocks above 150 days MA is following. This chart actually perfectly at least has very good indication where and when the market make a big down turn. 

  • The big down turn is when 20 days MA of this index cross down its 50 days MA and the index itself cross down 20 days MA
  • what is current condition
    • 20 days MA of this index point up
    • 50 days MA of this index go flat
    • 20 days MA of this index still above its 50 days MA
    • index touch top BB
    • The BB of this index is squeezed very much to be ready to shoot up
In summary, the market is not ready to have big down yet. Can the market make big break out? It is only when the top BB be expanded much higher. Only when "20 days MA of this index cross down its 50 days MA and the index itself cross down 20 days MA" happened, the short can prevail. 


The short time frame (1 hour ) chart is below. It can still guide the short term move of the market within next several days. The index break out the triangle. and fill the gap at 2294 and close at 2298.31. It hold the gap fill (a bullish pattern). Nest several days' movement is labeled on the chart. 
  • back test level 2290, then hold up to retry 2300
  • back test all the way down to lower trend line around 2280 gap fill, then reverse the course up.
  • if shoot up over level 2300, the price may stop to touch upper trend line.


The gold/USD ratio comes to critical resistance. The 200 days MA meet level resistance 0.95. This confluence will act a good resistance, if the price can overcome this resistance, a sizable upside run will happen, target 1.025.


2/4/2017: E-mini (ES) sp500 update

On last Friday (2/3/2017) the good NFP number poped ES gap up from 2283 to 2293.75. The high of 2293.75 is well lined up with my prediction on 2/2/2017 in blog. The VPOC is around 2291, value low is 2289, value high is 2293. The most transactions happened in a very narrow range of 4 points. Now ES back to range 2283 ~ 2299 (15 points range). 

Next session possible activity: 
  • if ES over 2293, it will challenge 2299 again (overnight or RTH); 
  • if ES below 2287, it will mostly fill the gap around 2274; 
  • if over 2299, it may get to 2310~2315.


Thursday, February 2, 2017

2/2: E-mini sp500 (ES) update

The E-mini sp500 future today swung multiple times, it ranges from 2266.75 to 2279.75 (13 points range). Following is the 1 hour chart of ES market volume profile. Several trend lines forms a triangle. Although the  price can break the triangle either way, the market profile actually showed the back and fill mode since break out at day of Jan 23rd. The most transactions happened around from 2265 to 2270 area which filled the void area from break out. It is a healthy pattern. Tomorrow 2/3, the economic news NFP will come out. This big news may trigger the break out or down from the triangle.  

Let's look at 4 hours market volume profile. Within last month, the VPOC is around 2265, and last 3 trading sessions' lows are inches lower and hold up the close above this pivot VPOC. So last several trading sessions are not very negative. 2286 is a very thin low volume area, it can act as a resistance, over it, the bull open up the field to attack up to 2293, then 2299.


2/2: market update

First, let's look at Nasdaq. The price opened high and got sold off first, then bounced up with a series of pushes and pulls. The close was down 6.54 points. Note, Nasdaq is the only index who filled this Monday's gap down gap in last 2 trading sessions. The price still runs in a big wedge, but now within a triangle. Watch which side of this triangle will be broken. The level support 5580 and 5520 acts as bounce level if breaking down lower triangle.  The upside still can be the top trend line.


Second, let's look at the sp500. Today the index swung like a yoyo back and forth for several rounds  and ended up with 1.63 point close up. The price still runs inside the uptrend channel, now it forms a triangle within the channel. The triangle can be broken either side. The level support and resistance are labeled on the chart: gap fill 2294.5 and 2300 are resistances; 2255, gap fill 2239, 2233 are supports.