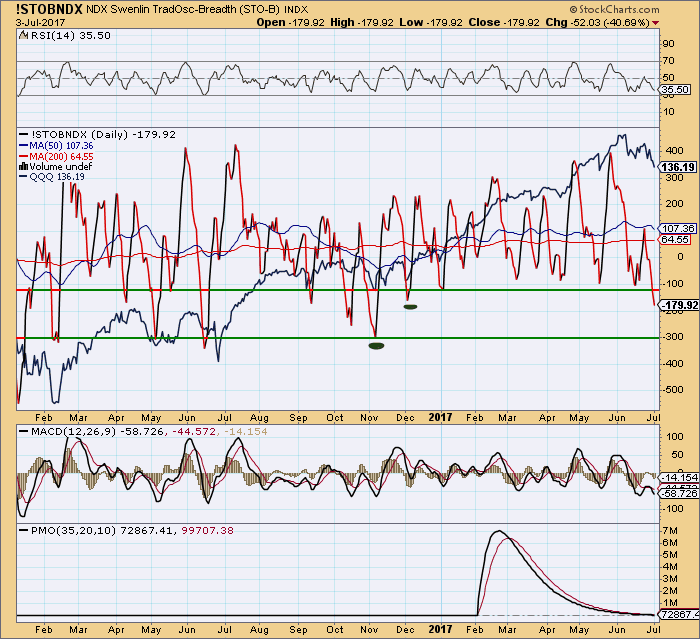
- Both breadth and volume oscillators start to turn north
- The PMO buy signal turn south (a sell signal)
- oscillators signals and PMO buy signal conflict now
- an undecided signal makes me step aside (no buy , no sell)
- buyers entry: 246, 245.5, 244.5
- sellers entry: 247.5, 248
Nasdaq 100 ETF: QQQ
- Both breadth and volume oscillators start to turn north
- hourly buy signal still exist, 4 hours signal showed almost bottom, daily signal still favor seller.
- the bull/bear line in the sand is around 144 (143.96), over it, the buyer will be in control, below it , the seller will be in control.
- upside target: 144.5, 145, 145.5, 146, if break out 149.
- downside target: 143, 142.5, 142, 141.5
SPDR Dow Jones Industrial Average ETF: DIA
- both breadth and volume oscillators keep moving up.
- daily buy signal still exist
- the strongest one in all index ETFs
- buy entry/support: 218, 217.75, 217, 216.5, 215
- upside target: 221
- The small cap ETF is weakest in last 4 trading days, both breadth and volume oscillators start to move back up , a positive sign
- hourly, 2 hours and 4 hours buy signal still exist, daily sell signal still exist, but almost bottom out (how to read this part, if hours' signals cannot reverse the daily signal, then the daily sell signal will prevail and hours signals will follow daily signal)
- support: 141, 140, 139
- resistance: 142, 144
Stocks to watch: BMY, GS, CUBE, SCHW