- the break even price $122
- potential gain ($10-$7)/$7 = 42.8%
- potential loss 100% (but you always can close position earlier to limit loss)
- The reason to choose it
- 100% seasonality positive in Dec
- note 1/22/2018 earning date
- the option date choosing next Jan is for more time value to decay
Saturday, December 9, 2017
12/9/2017 stock option pick
RCL (royal Caribbean cruise): long Jan/2018 115~125 call spread with around $7 premium
Wednesday, November 29, 2017
11/29/2017 stock option pick
AAPL: long call spread Feb, 2018 170~180 with cost $4.6~$5.00
- potential loss 100%
- potential gain 100%
- break even price around $175
- the price projected for apple in next Feb will be over $180
- suggestion: can close position earlier to take profit other than waiting to materialize the maximum 100% gain with potential risk (for example: when this spread runs to $7.5, 50% gain to take profit)
Sunday, November 26, 2017
11/26/2017 stock option pick
Google (GOOGL): long spread Jan 2018 $1030~$1060 call spread with $18/contract
- potential loss $18/contract, 100% loss
- potential gain $12/contract, 66% gain
- break even $1048
My personal opinion is not for investment purpose, but for education and illustartion
Tuesday, November 21, 2017
11/21/2017 stock option pick
CME Group (CME): long call spread Jan/2018 $140-$145 with $2.1, any price [$2~$2.2] can be a entry
- the potential maximum gain: ($5-$2.1)/$2.1 = 138%
- the potential ,maximum loss is 100%
- break even price: $142.1
- The Jan/2018 projection for CME price is around $145
Note: my personal opinion is not for investment, but for education and illustration
Monday, November 20, 2017
11/20/2017 weekly stock option pick
1. PYPL: long call spread Jan/2018 $72.5-$77.5 with $2.78, any price [$2.5~$2.8] can be a entry
- the potential maximum gain: ($5-$2.8)/$2.8 = 78.5%
- the potential ,maximum loss is 100%
- break even price: $75.3
- The Jan/2018 projection for PYPL price is around $77.5
Note: my personal opinion is not for investment, but for education and illustration
Saturday, November 11, 2017
10/11/2017 one insurance stock update
one insurance company broke out by nice price action after south east states' hurricane: travellers (TRV).

Note: my personal opinion is not for investment, but for education and illustration
- classic break out $130 level
- classic back test the break out level $130, then reverse up
- upside target moved up to $145.
- buyers' stop below $129.5

Note: my personal opinion is not for investment, but for education and illustration
Friday, November 10, 2017
11/10/2017 daily and weekly indices update
1. SP500:
- first weekly loss after 8 weeks winning streak
- inside day today from Thursday (11/9/2017)
- usually inside day is a positive sign this year
- strong resistance around 2585
- regaining 2585 by daily close will be a good sign for bull to regain the control
- vice versa to reverse down to test 2565 again
2. Nasdaq 100:
- still keep the weekly winning streak to 7 weeks
- inside day from Thursday (11/9/2017)
- usually inside day is a positive sign this year
- resistance around 6312
- regaining 6312 by daily close will be good sign for bull to regain the control
- vice versa to reverse down to test 6240~6248
3. Russell 2000:
- 5 weeks down in a row
- also inside day from Thursday (11/9/2017)
- usually inside day is a positive sign this year
- resistance around 1482~1485
- regaining 1482~1485 by daily close will be a good sign for bull to gain the control to reverse the recent down trend to uptrend
- vice versa to reverse down to test 1465~1467
4. Dow Industrial:
first weekly loss after 9 weeks winning streak
inside day today from Thursday (11/9/2017) but with red candle
resistance around 23475
- regaining 23475 by daily close will be a good sign for bull to regain the control
- vice versa to reverse down to test 23300
Note: my personal opinion is not for investment purpose, but for education and illustration
Monday, November 6, 2017
11/6/2017 stock option idea
Alibaba: BABA
- long call spread Jan Monthly 185~195 with $4.6 (yesterday's close), any price between $4.5~$4.6 is acceptable
- The potential gain is $10-$4.6/$4.6 = 117% if price close above $195 when option expire
- The potential loss is 100% if price close below $185 when option expire
- break even price: 189.6
- why choose $195?
- the projection price of BaBa for Jan is around $195~200.
Update on Facebook, Apple and Celgene option tade
FB: long call spread Dec Monthly 165~170 now at $4.33, any entry with $3.35 or less already has around 30% gain, the recommendation is keep the option spread to run, let more time value to decay. I will notice to close the position, otherwise let the spread run through expiration date.
FB: long call spread Dec Monthly 165~170 now at $4.33, any entry with $3.35 or less already has around 30% gain, the recommendation is keep the option spread to run, let more time value to decay. I will notice to close the position, otherwise let the spread run through expiration date.
Apple: long Nov 145~150 call spread now at $4.98(almost full $5 credit), any entry within $3.8 will get 31.8% gain. Recommendation is let the option spread be. There is very very slim chance, apple stock price will swing below $150 at expiration date (if you close it, you will lose penny, no big deal)
Celgene: long Dec 125~135 call spread now almost be worthless, I assume this is a bad trade unless some miracles happen.
Note: my personal opinion is not for investment, but for education and illustration.
Note: my personal opinion is not for investment, but for education and illustration.
Saturday, November 4, 2017
NASDAQ 100 Big Cap stock update
The stocks who had already reported 3rd quarters' earnings are discussed here. The several stocks such as NVDA ADSK not discussed here.
1. AMZN:


Note: my personal opinion is not for investment purpose, but for education and illustration.
1. AMZN:
- the price hold up 0.786 fib and bounce up
- the ATNH 1122.79 will be tested soon

2. GOOG:
- the price hold up the gap up low around 1008 and bounce up
- now it break out the 0.786 fib
- the ATNH 1048.39 will be tested soon

3 MSFT:
- The price hold up 0.618 fib and contained by 0.786 fib
- the price will consolidate between 0.618 fib and 0.786 fib before making directional move

4 NFLX:
- the price hold up 0.618 fib, now above 0.786 fib
- the price need overcome 201 to touch ATNH 204.38

5 FB:
- The price hold up 0.618 fib and contained by 0.786 fib
- the price will consolidate between 0.618 fib and 0.786 fib before making directional move

6 AAPL:
- watch 0.786 fib support around 170,
- it is a buy entry

7 BABA:

- the price hold up the 0.618 fib and contained by 0.786 fib
- the price will consolidate between 0.618 fib and 0.786 fib before making directional move
Note: my personal opinion is not for investment purpose, but for education and illustration.
Saturday, October 14, 2017
10/14/2017 weekly option ideas
Facebook: FB
- long call spread Dec Monthly 165~170 with $3.35 (Last Friday's close), any price between $3.3~$3.5 is acceptable
- The potential gain is $5-$3.5/$3.5 = 42.8% if price close above $170 when option expire
- The potential loss is 100% if price close below $165 when option expire
- break even price: 168.5
- why choose $170?
- the projection price of facebook for Dec is around $180, choose $170 strike gives more room for fault tolerance
Update on Apple and Celgene option tade
Apple: long Nov 145~150 call spread now at $4.08, any entry within $3.8 is above water now. There is still around 1 month time for the trade to work out, I try to sweep the gain of $1.2 per contract.
Celgene: long Dec 125~135 call spread now at $7, any entry around $7.5 is under water now. There is still 2 months for the trade to work out, no need to be panic for cutting loss yet.
Note: my personal opinion is not for investment, but for education and illustration.
Note: my personal opinion is not for investment, but for education and illustration.
10/14/2017 indices update
1. SP500:


- So far the price runs within a grinding uptrend channel
- 2 possible targets from price action
- still buck the grinding uptrend, top trend line is the resistance
- break down grinding trend channel
- target: 2535~2540

2. Nasdaq composite:
- So far the price runs within a grinding uptrend channel
- 2 possibile targets from price action
- still buck the grinding uptrend, top trend line is the resistance
- break down grinding trend channel
- target: 6530~6540

Note: my analysis is not for investment, but for education and illustration.
Sunday, October 8, 2017
10/8/2017 healthcare stocks price update
1. AET


- price target hike to $177~$178
- cup and handle pattern, wait for break out (164 break out) to jump in
- buy dip still good around 150~152

2. UNH
- price target hike to $210
- reverse head and shoulder patter, wait for break out (200 break out) to jump in
- buy dip still good around 190~192

Note: My personal opinion is not for investment purpose. but for illustration and education
10/7/2017: weekly option idea
1. Apple:
Note: my recommendation is not for investment purpose, but for illustration and education.
- long call spread Nov Monthly 145~150 with $3.73 (Last Friday's close), any price between $3.7~$3.8 is acceptable
- The potential gain is $5-$3.8/$3.8 = 31.5% if price close above $150 when option expire
- The potential loss is 100% if price close below $145 when option expire
- why choose $150?
- $150 is recent iphone launch swoosh down support
- please note the risk of this option trade will expire after apple's Nov earning
2. Celgene:
- long call spread Dec monthly 125~135 with $7.5 (last Friday's close), any price between $7.4~$7.6 is acceptable
- The potential gain is $10-$7.5/$7.5 = 33% if price close above $135 when option expire
- The potential loss is 100% if price close below $125 when option expire
- Why choose $135?
- The $135 is around 80 days MA support
10/7/2017 Indices update
1. SP500 update:


- September monthly close is positive
- weekly MACD golden cross happened 2 weeks ago
what it tells, the positive October is ahead. Any sizable dip should be bought without hesitation. The question is when the sizable dip will happen? Let's look at one chart which could give us some clues if not the whole detailed clues.

- The key point is shall we get the death cross on MACD/PMO of the chart of ratio of SPY:$VIX on daily basis:
- if yes, since the MACD line at so high now, it is hard to reverse back up to make golden cross again. Then the market will eventually make sizable correction. I will talk about the correction target after the death cross happens.
- if no, the market will squeeze higher still.
2. Russell 2000 update:
- almost one and half month run up, the extremely overbought condition need to be corrected
- the possible retrace path is shown in the chart
- better to wait for the pull back finished to buy in (no hurry to buy)

3. Nasdaq 100 update:
- QQQ break out 146 on last Wed with MACD golden cross on daily basis, the run-up is not finished yet.
- The trading/investing strategy is still buy dip with confidence
4. Dow Jones industrial index update:
- The strategy should be same as SP500, watch if volatility takes off next week sometime
- If yes, wait out for the volatility settle down to buy in
Note: my personal opinion is not for investment purpose, but for illustration and education purpose.
Saturday, September 30, 2017
9/30/2017 index ETF update
SP500 index and ETF: SPY
- The breadth and volume oscillators are both bouncing up hard since the price bottom on 9/25/2017, these indicators runs with trend mode (not a range mode)
- buy/sell signal: buy
- The PMO signal still in buy zone
- SPY levels:
- buy levels: 250, 249, 248, 247, 246, 245.2 (gap fill)
- sell levels: 252, 254, 255.35 (potential reverse head and shoulder pattern target)
Nasdaq 100 ETF: QQQ
- Both breadth and volume oscillators bouncing up hard since the price bottom on 9/25/2017
- buy/sell signal: buy
- buy entry: 145, 144, 143.5, 143
- sellers entry: 146, 146.5, 148
SPDR Dow Jones Industrial Average ETF: DIA
- both breadth and volume oscillators keep moving up
- buy/sell signal: buy
- buy entry: 223, 222, 221
- sell entry: 225, 226 (measured move target)
- both breadth and volume oscillators keep moving up
- buy/sell signal: buy
- buy entry: 146.5, 145, 143, 142
- sell entry: 151, 155 (measured move)
Final word: all indices made all time new high at the end of September. All breadths are very healthy and strong, the first pullback in October initially is estimated shallow and buy the dip. I am kind of leaning to the weakness will happen until the middle of October ( however, I am not a timing fan though, I like price action more to trigger the trade)
Note: my personal opinion is not for investment purpose, but for education and illustration.
Friday, September 15, 2017
9/15/2017 Sp500 and index ETF update
SP500 index and ETF: SPY

- The breadth momentum and volume momentum oscillators still point up, the price may keep going up
- The breadth and volume oscillators are both pointing up still, the price may keep going up
- buy/sell signal: buy
- The PMO signal still in buy zone
- The following chart shows the key levels:
- upside target 2510
- downside supports: 2480, 2470, 2460 (gap fill)
- SPY levels:
- buy levels: 248, 247, 246, 245.5
- sell levels: 250.5

http://schrts.co/DSTa7H
Nasdaq 100 ETF: QQQ
- Breadth momentum oscillator get flat, volume momentum oscillator keep inch up.
- Both breadth and volume oscillators keeps moving up, their own 50 days MA keeps moving up, it indicates the upside not done yet
- Both 5 days MA and 10 days MA of the Nasdaq composite keep going north and 10 days MA works as support
- buy entry: 145, 144, 143
- sellers entry: 146.5, 148
SPDR Dow Jones Industrial Average ETF: DIA
- both breadth and volume oscillators keep moving up
- both breadth and volume momentum oscillators keep moving up, the RSI overbought a little
- buy/sell signal: buy
- buy entry: 222, 221, 220, 219, 218 (gap fill)
- sell entry: 225
- both breadth and volume oscillators keep moving up
- both breadth and volume momentum oscillators keep moving up, the RSI in overbought zone
- buy/sell signal: buy
- buy entry: 141.5, 141, 140.5, 139.25 (gap fill)
- sell entry: 143.5
Final word: the market keeps moving higher and the strategy should be tighten up for long, keep stop tight, while the long enjoy the up-wave ride, the cautions operation is also needed.
Note: my personal opinion is not for investment purpose, but for education and illustration.
Saturday, August 26, 2017
8/26/2017 index ETF signal update
SP500 ETF: SPY


Note: my personal opinion is not for investment purpose, but for education and illustration.
- Both percent of stocks above 50 days MA (around 41) and 100 days MA (around 48) were still in comparable low in 2017 and start to move back up
- Both breadth and volume oscillators continue moving up, the recent down trend may reverse soon.
- The PMO signal start to show life and turn north, if it can cross up its own 20 days MA, the buy signal is confirmed
- buyers entry: 243.5, 244
- sellers entry: 245.5, 246.5

A reference from last September: when SPX touched bollingar band middle line on weekly chart, the price bounced up 3 weeks in a row and the high touched the neckline. What about this August bounce or no bounce to continue down.? The current neckline is at 2475.
Nasdaq 100 ETF: QQQ
- Both breadth and volume oscillators keeps moving up, their own 20 days and 50 days MA MA also turn north, it indicates most probably the recent down trend is ending
- Both 5 days MA and 10 days MA of the Nasdaq composite turned north.
- buy entry: 140.5, 141.5
- sellers entry: 143.25, 144

SPDR Dow Jones Industrial Average ETF: DIA
- both breadth and volume oscillators keep moving up
- the buy signal is fired up, buy dip
- buy entry: 216.5, 217, 217.5
- sell entry: 219, 219.5, 220
- both breadth and volume oscillators surged on last Friday
- Buy signal is fired up
- buy entry: 136, 136.5
- sell entry: 139, 139.5
Tuesday, August 22, 2017
8/22/2017 Sp500 update
The SP500 made all time new high at 2490.87 on 8/8/2017, thereafter several series of sell offs took place.


The elliott wave pattern is analyzed as following:
- The 2490.87 high is assumed the top of wave 5-3
- Sp500 is in wave 5-4 correction wave
- wave 5-4-A is finished at 2417.35
- wave 5-4-A includes A-B-C push down
- wave 5-4-B is on going
- important fib levels to watch
- 0.5 fib 2454.12
- 0.618 fib 2462.79
- in case of irregular correction pattern (flat correction or expanded flat correction)
- sp500 could overshoot to 2500 area
- The support level 2440
- after wave 5-4-B finished, then we can project final down wave wave 5-4-C.
Today sp500 breadth and volume oscillators made bottom divergence, the further upside of the index is expected.
My personal opinion is not for investment purpose, but for education and illustration.
Sunday, August 13, 2017
8/13/2017 index ETFs' update
SP500 ETF: SPY

Note: my personal opinion is not for investment purpose, but for education and illustration.
- Both percent of stocks above 50 days MA (around 62) and 150 days MA (around 40) made comparable low in 2017, this weakness also indicate potential reversal anytime soon
- Both breadth (-184) and volume (-207) oscillators made comparable low in 2017, this weakness also indicate potential bottom formed soon.
- The PMO signal is still sell (but it does not tell if it can reverse next day or 2)
- The equity put call ratio at 0.94: 2nd highest in 2017, 11/2016 pcr high is at 0.99.
- buyers entry: 243, 242
- sellers entry: 245.5, 246.5

Nasdaq 100 ETF: QQQ
- Breadth oscillator keeps inch down into ETF potential rebound range and volume oscillator waver to turn north
- Both percent of stocks above 50 days MA and 150 days MA made new low in 2017 and comparable low with last December, both oscillators rebound a little last Friday
- buy entry: 141
- sellers entry: 143
SPDR Dow Jones Industrial Average ETF: DIA
- both breadth and volume oscillators keep moving down and made comparable low in 2017
- the buyers should hold fire or buy with caution
- no suggestion for short though
- both breadth and volume oscillators keep moving down and made comparable low in 2017
- Both percent of stocks above 50 days MA and 10 days MA made comparable low in 2017, this weakness also indicate potential reversal anytime soon
- buy entry: 136
- sell entry: 139
Thursday, August 10, 2017
8/9/2017 index ETFs' update
SP500 ETF: SPY
- Both breadth and volume oscillators move south again
- The PMO signal is sell
- However, the oscillators' readings are in low range that the bounce can happen anytime soon
- buyers entry: 246.5, 246, 245.68, 244.5
- sellers entry: 247.5, 248, 249
Nasdaq 100 ETF: QQQ
- Both breadth and volume oscillators waver to turn north
- furthermore, the oscillators' readings are in the low range that the rebound can happen anytime soon
- daily buy signal comes back.
- buy entry/support: 143.5, 142.5
- if 142.5 break down, buyers can take stop loss
- upside target: 144.5, 145, 145.5, 146, if break out 149
SPDR Dow Jones Industrial Average ETF: DIA
- both breadth and volume oscillators keep moving down
- the buyers should hold fire and wait
- no suggestion for short though
- Although the small cap behaved the worst on 8/9, both breadth and volume oscillators turned north again
- furthermore, the oscillators' readings are in the low range where middle of June bounce and early July bounce
- the daily buy signal comes back
- support: 138.4, 137.5
- resistance: 139.5, 140, 140.5, 141,5
Saturday, August 5, 2017
8/5/2017 index ETFs and certain stocks update
SP500 ETF: SPY
- Both breadth and volume oscillators start to turn north
- The PMO buy signal is neutral
- daily buy signal comes back again
- buyers entry: 246.7, 245.68, 244.5
- sellers entry: 247.5, 248, 250
Nasdaq 100 ETF: QQQ
- Breadth oscillator start to turn north
- Volume oscillator keep going lower, but this low level can turn north anytime from statistics
- daily buy signal comes back.
- upside target: 144.5, 145, 145.5, 146, if break out 149.
- downside target: 143, 142.5, 142, 141.5
SPDR Dow Jones Industrial Average ETF: DIA
- both breadth and volume oscillators keep moving up.
- daily buy signal still exist
- the strongest one in all index ETFs
- buy entry/support: 218, 217.75, 217, 216.5, 215
- upside target: 221
- Both breadth and volume oscillators turned north again (like last Thursday mentioned, it will turn back up soon)
- the daily buy signal comes back
- support: 141, 140, 139
- resistance: 142, 144
Stocks to buy: FTNT, MU, XLNX
Tuesday, August 1, 2017
8/1/2017 index ETFs update
SP500 ETF: SPY
- Both breadth and volume oscillators start to turn north
- The PMO buy signal turn north too (a buy signal)
- oscillators signals and PMO buy signal align together now
- daily buy signal comes back again
- buyers entry: 246.7, 245.68, 244.5
- sellers entry: 247.5, 248, 250
Nasdaq 100 ETF: QQQ
- Both breadth and volume oscillators start to turn north
- daily buy signal comes back.
- upside target: 144.5, 145, 145.5, 146, if break out 149.
- downside target: 143, 142.5, 142, 141.5
SPDR Dow Jones Industrial Average ETF: DIA
- both breadth and volume oscillators keep moving up.
- daily buy signal still exist
- the strongest one in all index ETFs
- buy entry/support: 218, 217.75, 217, 216.5, 215
- upside target: 221
- The small cap ETF is weakest in last 4 trading days, both breadth and volume oscillators reverse back down again, however, it may reach the bottom soon
- hourly, 2 hours and 4 hours buy signal still exist, daily sell signal still exist, but almost bottom out (how to read this part, if hours' signals cannot reverse the daily signal, then the daily sell signal will prevail and hours signals will follow daily signal)
- support: 141, 140, 139
- resistance: 142, 144
Monday, July 31, 2017
7/31/2017 index ETFs update
SP500 ETF: SPY
- Both breadth and volume oscillators start to turn north
- The PMO buy signal turn south (a sell signal)
- oscillators signals and PMO buy signal conflict now
- an undecided signal makes me step aside (no buy , no sell)
- buyers entry: 246, 245.5, 244.5
- sellers entry: 247.5, 248
Nasdaq 100 ETF: QQQ
- Both breadth and volume oscillators start to turn north
- hourly buy signal still exist, 4 hours signal showed almost bottom, daily signal still favor seller.
- the bull/bear line in the sand is around 144 (143.96), over it, the buyer will be in control, below it , the seller will be in control.
- upside target: 144.5, 145, 145.5, 146, if break out 149.
- downside target: 143, 142.5, 142, 141.5
SPDR Dow Jones Industrial Average ETF: DIA
- both breadth and volume oscillators keep moving up.
- daily buy signal still exist
- the strongest one in all index ETFs
- buy entry/support: 218, 217.75, 217, 216.5, 215
- upside target: 221
- The small cap ETF is weakest in last 4 trading days, both breadth and volume oscillators start to move back up , a positive sign
- hourly, 2 hours and 4 hours buy signal still exist, daily sell signal still exist, but almost bottom out (how to read this part, if hours' signals cannot reverse the daily signal, then the daily sell signal will prevail and hours signals will follow daily signal)
- support: 141, 140, 139
- resistance: 142, 144
Stocks to watch: BMY, GS, CUBE, SCHW
Saturday, July 29, 2017
7/29/2017 index ETF update and stock picks
SP500 ETF: SPY
- Although breadth oscillator keeps moving down, volume oscillator start moving back up.
- The PMO buy signal turn north again
- daily buy signal still exist
- buy entry/support: 246, 245.5, 244.5
- profit/resistance: 247.2, 247.5, 248, 249
Nasdaq 100 ETF: QQQ
- Although both breadth and volume oscillators keep moving down, volume oscillator may start moving back up
- hourly buy signal still exist, 4 hours/daily signals do not favor buyer.
- the bull/bear line in the sand is around 144 (143.96), over it, the buyer will be in control, below it , the seller will be in control.
- upside target: 144.5, 145, 145.5, 146, if break out 149.
- downside target: 143, 142.5, 142, 141.5
SPDR Dow Jones Industrial Average ETF: DIA
- both breadth and volume oscillators turn north.
- daily buy signal still exist
- buy entry/support: 217.75, 217, 216.5, 215
- upside target: 221
- The small cap ETF is weakest in last 3 trading days, both breadth and volume oscillators keepo moving down, however, it may be the first one to start the bounce, if whole market stop bleeding
- hourly, 2 hours and 4 hours buy signal still exist, daily sell signal still exist (how to read this part, if hours' signals cannot reverse the daily signal, then the daily sell signal will prevail and hours signals will follow daily signal)
- support: 141, 140, 139
- resistance: 142, 144
Stocks to watch:
- insurances: HIG, MET, TRV
- railroad: UNP, NSC
- oil services: MUR, OXY
- pharmacy benefit management: ESRX
ETFs to buy: IHI, IHF (all get 50 days MA support)
Tuesday, July 25, 2017
7/25/2015 index ETFs' signal
SP500 ETF SPY:
- both breadth and volume oscillators turn north again
- bullish percentage index keeps climbing up and not top out yet
- buy/sell signal: daily buy signal still exist, buy dip
- buy entry/support: 246.75 (gap fill)/246; 245.5/244.5
- upside resistance/target:
- resistance: 247.75
- target: 248.75 after break out 247.75
RUSSELL 2000 ETF IWM:
- both breadth and volume oscillators turn north again
- the price made all time new high today
- buy/sell signal: daily buy signal still exist, buy dip
- buy entry/support: 143.25; 142.75; 142; 141.25
- upside resistance/target:
- resistance: 144.25
- target: 145.25 after break out 144.25
- both breadth and volume oscillators keep moving lower
- bullish percentage index seesaw to lower
- buy/sell signal: daily buy signal still exist, buy dip
- buy entry/support: 143.5; 142.5; 141.5
- upside resistance/target;
- resistance: 144.75
- target: 145.5/146 after break out 144.75
Dow Jones Industrial average ETF DIA has same set up as SPY. It is also buy dip.
Within all these indices ETFs, QQQ is weakest so far and should still under performs in short term.
ES levels:
- supports: 2468, 2461
- pivots: 2473
- resistance: 2480, 2486
Saturday, July 15, 2017
7/15/2017 index ETF signals
Three major indices' breadth and volume oscillators come into a little bit overbought area. Nasdaq 100 was into overbought zone more. But all indicators have not turn south, there is no apparent sell or short signal yet. Based on the break out price action from dow industrial and sp500, the recommended next week trading strategies are
Nasdaq 100 ETF QQQ


Nasdaq 100 ETF QQQ
- still buy dip
- buy zone/stop [140,140.5]
- sell level 142.2
- based on the downtrend line break out pattern ,the inter medium upside price target is updated

SP500 ETF SPY
- still by dip
- buy zone/stop [244, 244.5]
- based on the downtrend line break out pattern, the inter medium upside target is updated to 248

Rusell 2000 ETF IWM
- still buy dip
- buy zone/stop [139.5,140]
- the next half of 2017 target of IWM is still at 148~150
Thursday, July 13, 2017
7/13/2017 index ETFs' signals
SP500 ETF SPY:
- PMO buy signal was fired up today, the new high is expected to come;
- both volume and breadth oscillators still showed upward momentum (not overbought yet);
- support/buy zone [243, 243.5];
- recommended trading strategy: buy dip, wait for new high, midterm upside target [248,250]
Nasdaq 100 ETF QQQ:
- both volume and breadth oscillators showed close to overbought condition;
- price action showed the consolidation will be still the next several sessions' trading theme, consolidation range [139.5, 141.5];
- suport/buy zone [ 139.5, 140];
- recommenced trading strategy: buy low sell high, mostly range trading in next trading session
- Regard to individual stock within Nasdaq 100, there will be different strengths showed in different stocks. The ones who climbed fast several days ago may take a rest now, the ones who stayed calm will move up.
Russell 2000 ETF IWM:
- buy signal still exist;
- support/buy zone [139,140];
- recommended trading strategy: buy dip, the midterm upside target still is [148,150]
Dow Jones Industrial ETF DIA:
- buy signal still exist;
- support/buy zone [212.5, 214.5];
- recommended trading strategy: buy dip, new high, mid-term upside target 218
Wednesday, July 12, 2017
7/12/2017 index ETF signals
Nasdaq 100 ETF QQQ:
- buy signal still exist
- strategy: buy dip
- buy level: 140
- upside target: 142
Russel 2000 ETF: IWM
- buy signal still exist
- strategy: buy dip
- buy level : 50 天线
- upside target: 148~150
SP500 ETF: SPY
- buy signal still exist
- strategy: buy dip
- buy level:242
- upside target: 248
Note: buy level can be a threshold for bull/bear line
My personal opinion is not for investment purpose, but for education and illustration
Monday, July 10, 2017
7/10/2017 stocks option play
One of the defense stock Raytheon is one a tear to ramp up, my price target is around 200. Two ways to play this long setup:
- The long call spread:
- long Feb, 2018 call spread [150,190], the current cost is $18.35 per contract
- the potential gain is $190-$150-$18.35= 21.65 per contract
- the potential loss is $18.35 per contract
- break even price: $168.35
- The long broken wing butterfly:
- long Feb, 2018 broken wing butterfly: [170,190,200], the cost is $4.64 per contract
- the potential gain: peak gain: $1268 per contract, right wing gain: $464 per contract
- the potential loss is $4.64 per contract
- break even price: $174.64
Another managed healthcare stock Unitedhealthcare is still a long term uptrend stock, the target for it is around 220.
- The long call spread:
- long Jan, 2018 call spread [150,210], the current cost is $37.5 per contract
- the potential gain is $210-$150-$37.5 = $22.5 per contract
- the potential loss is $37.5 per contract
- break even price: $187.5
Tuesday, July 4, 2017
7/4/2017 Nasdaq 100 (QQQ) update
Recent FANNG/FAMNG/Nasdaq 100 sharply down makes QQQ traders/investors in a hurry to exit or avoid these stocks and ETF. The following analysis is trying to get some ideas on how current Nasdaq 100 is devoloping.
First, let's look at chipset leader: applied materials (AMAT).


First, let's look at chipset leader: applied materials (AMAT).
- all weekly technical indicators are negative
- right on 20 weeks MA support around 41
- since early 2016 bottom out, the price has not violated the 20 weeks MA support

Second, let's look at one of FANG: google (GOOG)
- all weekly technical indicators are negative
- right on 20 weeks MA support around 889.88
- since 2017 in the uptrend, the price has not violated 20 weeks MA support

Last, let's look at Nasdaq 100 ETF: QQQ.
- all weekly technical indicators are negative
- above 20 weeks MA support around 135.17
- since early 2017 in the uptrend, the price has not violated 20 weeks MA support.
In summary, the 20 weeks MA act as a good and possible bounce level for Nasdaq 100. Nasdaq 100 future September contract: NQU7 20 weeks MA is around 5558. If the 20 weeks MA failed to make suport, next support is the gap fill around 132.5, if the gap fill still failed to support, the worst case 50 weeks MA 125 is the last and must hold level for bull.
Let's look at Nasdaq100 breadth.
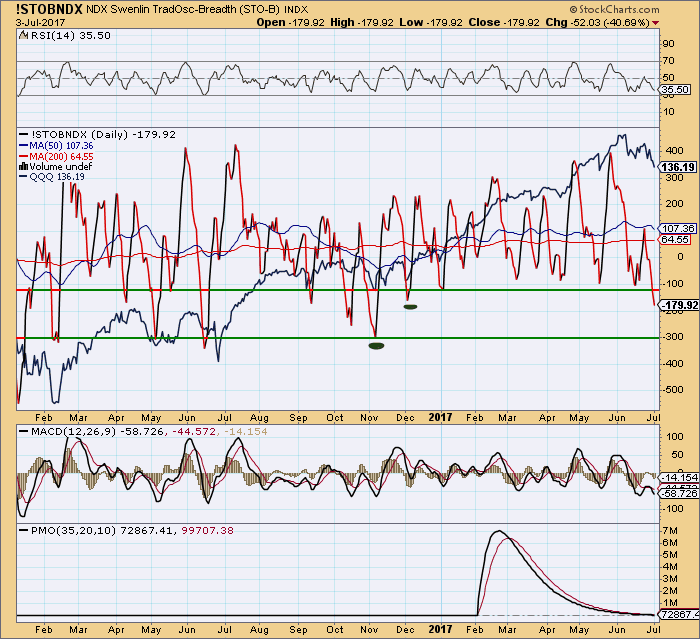
Nasdaq100 breadth has fall into the oversold zone, very close to 2016 Feb low, June low, Nov low, already made new in 2017. It is a contrarian signal. Within anytime, QQQ will bottom out.
My personal opinion is not for investment purpose, but for education and illustration purpose.
Sunday, June 25, 2017
6/25/2017 Created my own Semiconductor ETF
Right now this post is only a place holder for access privilege test.
Right now this post is only a place holder for access privilege test.
Right now this post is only a place holder for access privilege test.
Right now this post is only a place holder for access privilege test.
Right now this post is only a place holder for access privilege test.
Right now this post is only a place holder for access privilege test.
Right now this post is only a place holder for access privilege test.
Right now this post is only a place holder for access privilege test.
Right now this post is only a place holder for access privilege test.
Right now this post is only a place holder for access privilege test.
Right now this post is only a place holder for access privilege test.
Sunday, June 18, 2017
6/18/2017 stock picks (semiconductors)
Recent Nasdaq pullback really put semiconductors in a spot that we need pay attention to have positions in this sector. Several small caps are scanned out by my system.
1. MKSI:


1. MKSI:
- fundamentals: major customers are lam research and applied materials. These 2 companies are hot leading semiconductors in the sector. So buying MKSI has similar buying action on LRCX and AMAT
- technically on trend line support

2. ACLS:
- fundamentals: first quarter of 2017 revenue growth almost double of applied materials and lam research
- technically back above trend line, short terms MAs point up

In summary, these 2 picks are long term player. I do not recommend to put stop in.
Note: my personal opinion is not for investment purpose, but for education and illustration.
Monday, May 29, 2017
5/29/2017 sp500 breadth analysis
After briefly market comes to new high, sp500 has already inked 7 consecutively up days. Everyone is concerned about how the market will develop in next several trading sessions. The breadth analysis is following:
1. The percentage of sp500 stocks above 50 days MA. The reason of not using 200 days MA or 100 days MA is that the index still above 50 days MA, no need worry about 100 days MA or 200 days MA for now.


1. The percentage of sp500 stocks above 50 days MA. The reason of not using 200 days MA or 100 days MA is that the index still above 50 days MA, no need worry about 100 days MA or 200 days MA for now.

2. breadth momentum oscillator which can confirm the current sp500 breadth.

In summary, the breadth momentum oscillator confirmed the current index breadth is improving and will be improved further. It is a very positive sign for the bull. The pull back will happen, but it will be manageable and small. Buy dip is the best deal still.
My personal opinion is not for investment, but for education and illustration.
Sunday, May 28, 2017
5/28/2017 some stocks update
The update in this blog includes: Amazon, Google, Avago.
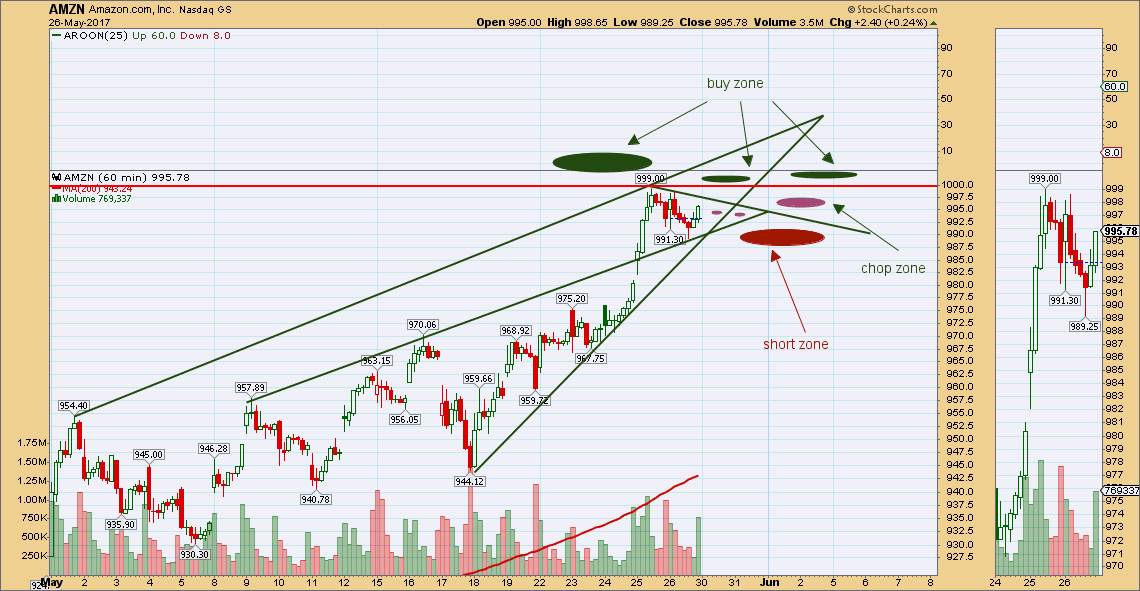
1. Amazon:


1. Amazon:
2. Google:

3. Avago:

In summary, all buying and selling/shorting zones are labeled on the chart.
- buying: buy dip
- selling/shorting: sell the rip
My personal opinion is not for investment, but for education and illustration.
Sunday, May 21, 2017
5/21/2017 what to buy/hold if market roll down
Some analysis about what to hold/buy if market start to roll down is discussed here.


- Transportation ETF: IYT

2. financial ETF: XLF

My personal opinion is not for investment purpose, but for education and illustration.
Saturday, May 20, 2017
5/20/2017 SP500 wave structure analysis
Since the index hit 2352.72 on 5/18/2017, it reverse up to 2389.06 before around 8 points pullback. There are 2 wave counts possible for the index.
The first is bull wave count. Please refer to 4/301/2017 blog that the reverse head and shoulder pattern still is valid.
http://faithwithseedbest.blogspot.com/2017/04/4302017-sp500-wave-structure-analysis.html

 http://schrts.co/hb2qpF
The first is bull wave count. Please refer to 4/301/2017 blog that the reverse head and shoulder pattern still is valid.
http://faithwithseedbest.blogspot.com/2017/04/4302017-sp500-wave-structure-analysis.html

- wave 5-3-5-1: 2405.77
- wave 5-3-5-2: 2352.72
- wave 5-3-5-3: target 2438 (wait and see if it can break out 2406)
- wave 5-3-5-4: wait for where wave 5-3-5-3 stop.
The second is bear wave count.

- wave 5-3-4-a: 2322.25
- wave 5-3-4-b: 2405.77
- wave 5-3-4-c:
- first possible target: 2320
- second possible target: 2300
- third possible target: 2285
After wave 5-3-4, then wave 5-3-5 will start.
How to tell it will evolve into a bull or bear path: watch the recent low 2352.72, if not break this support, the bull path still is valid.
How to tell it will evolve into a bull or bear path: watch the recent low 2352.72, if not break this support, the bull path still is valid.
My personal opinion is not for investment purpose, but for education and illustration.
Sunday, May 14, 2017
5/14/2017: sp500 analysis and possible path
It has been a while that the sp500 index consolidate below 2400 and above 2380. It is time to make some resolution to resolve the market move? Following is the analysis of some important levels to watch and measured moves for target hit. The corresponding possible path is posted.


- small consolidation box [2380, 2400], upside measured move: 2420, downside measured move 2360 (match the big consolidation box's middle line)
- big consolidation box [2420, 2400], upside measured move 2480, middle line at 2360
- bottom support arc drawn on the chart
- path: honor the bottom support arc up to 2420-> 2400-> 2480
- path: break down box [2380,2400] and the support arc and move down to 2360, then reverse the course, ->2360->2420->2400->2480
If the index break down 2360, the path will be totally different and is not discussed here so far. Currently I am still maintain my bullish view as it is.
My person opinion is not for investment purpose, but for education and illustration.
5/14/2017 stock picks
Recent sector money flow analysis showed money flew into utility sector such as verizon, AT&T, etc. here I am recommending to buy several stocks in same category.
The first one is water utility stock: AWK.


The first one is water utility stock: AWK.
- the bull/bear neckline 75 was hold for daily chart
- technical indicators: RSI, STOs, CCI all improve to move up
- annual dividend $1.5, no sign to reduce the dividend yet
- potential upside price target back to $81 area.

In summary, this low beta (0.19) water utility is good to have a entry here to have both price appreciation and dividend accumulation for long term. The long term upside price target is around $90.
The second one is consumer conglomerate P&G.
- 200 days MA get support
- uptrend trend line still hold
- the bull/bear neckline around 86 still hold
- annual dividend $2.75
- potential gap fill around $84

In summary, the buy entry: current price or gap fill around 84, the longer term target is around $91, if break out $91, next is $105.
My personal opinion is not for investment purpose, but for education and illustration.
Sunday, April 30, 2017
4/30/2017 sp500 wave structure analysis and target projection
There are two arguments about current market's short term direction. I am describing them as following:
- The short term bullish view with wave 5-3-4 finished at 2328.95 (a truncated wave C finish)
- as long as sp500 hold 0.382 fib around 2354, this wave structure is still valid
- also the level 2354 can act as the reverse head and shoulder's right shoulder
- it is not necessary, the price has to hit 0.382 fib before making reversal, it can reverse the course by any fibs: 0.618: 2371, 0.5: 2363
- the upside wave 5-3-5 target is around 2479.71

- The short term bearish view with wave 5-3-4 not finished yet, a flat corrective wave structure
- wave 5-3-4-B finished at 2398.16
- wave 5-3-4-C is on going, at least back to 2322, if break down, the target can go lower to 2260 area

In summary, I am leaning to the first case that we are in wave 5-3-5 now, any corrective wave within wave 5-3-5 will not break down 0.382 fib.
Note, my personal opinion is not for investment purpose, but for education and illustration.
Tuesday, April 18, 2017
4/18/2017 Sp500 pullback pattern similarity study

In this post, the pullback study is investigated between trump election in last Autumn and trump rally fade in this spring. Some interesting patterns are derived and projected for this trump rally fade pullback path.
- The trump election pullback was executed by 3 down waves in the chart
- The current trump rally fade pullback has been already executed by 2 waves (not down the 2nd waves)
- The trump election pullback under the down trend line, the current trump rally fade pullback is expected under the down trend line too.
- Another interesting is the trump election pullback neckline is around 2120 (actual fractal is 2119.12), the current trump rally fade pullback's neckline is 2320 (actual fractal is 2322.25)
- The trump election high is 2193.81 close to round number 2200, the current trump rally high is 2400.98 (round number 2400)
- The trump election pullback 2nd wave low (2114.72) is 4.4 points lower than 1st wave low 2119.12. Can we derive current pullback 2nd wave low is around 2322.25-4.4 = 2317.85?
- In trump election pullback, each wave's high will hit down trend line. We expect so for the current pullback.
- 3 waves pull back and each wave will hit down trend line (2nd wave hit down trend line multiple times)
- the 2nd wave will make a faked neckline breakdown, then push up to the down trend line, so we are in 2nd wave down and need make a run up to down trend line within next 1 or 2 days, then reverse back to make the faked neckline (2320) break down, only the estimated level can be made here around 2316, then push up again to the down trend line.
- then the 3rd wave down will be much more straightforward with less zigzag actions. The downside target is a huge zone from 2240 to 2280.
- Of course, if in any stage, the index over 2350 and close above it by daily, my pattern matching study result may not work anymore.
Saturday, April 15, 2017
4/15/2017 Sp500 pullback wave analysis
The sp500 had a very weak close on last Thursday at 2328.95, decisively broke down 2340. The next stop of sp500 is around 2300. By using the wave 5-3-4-a to wave 5-3-4-b fib extensions to have following estimation of the end of wave 5-3-4 (5-3-4-c)

- 100% fib: 2322.25
- 123.6% fib: 2309.1 (nearby gap: 2307.9)
- 132.8% fib: 2300.7
- 150% fib: 2294.1 (nearby gap 2295)
- 161.8% fib replaced by wave 5-3-3 0.618 fib: 2279.81 (nearby gap 2280.74)
- 200% fib: 2266.14 (nearby gap: 2265)
- 5% pull back rule from 2400.98 high is 2280.93

In summary, either one of the above fibs can act as supports to create bounce, if the bounce can turn into a reversal is to see if it can surpass the resistance zone [2340,2350] and stand above it.
Note: my personal opinion is not for investment but for education and illustration.
Friday, April 14, 2017
4/14/2017 small bios pick
It has been for a long while I have not played small bios since I changed my strategy in 2017 (mostly big cap stocks and ETFs, etc). It is time to review several possible play in small bio-techs. I treat all these small bio-techs play as speculation play.
The first one is PGNX: a prostate cancer player.
 In summary, the buy levels are $8 and $7. The initial buy batch entry is around $8 and second batch entry is around $7. The upside target is around 11+ and above.
The second one is NLNK: an inhibitor method to attack immune system disease company.


The first one is PGNX: a prostate cancer player.
- the price bounced off the level support around $8
- weekly chart seems stop bleeding
- both weekly fast and slow STOs get to oversold zone

The second one is NLNK: an inhibitor method to attack immune system disease company.
- we played this stock in last September from $12 to around $15 (blue box break out)
- the bigger green box break out is missed (not followed the stock since sold)
- now price come into the top of break out green box.
- daily both slow and fast STOs indicate oversold.
- the support levels at the top of box is around $15, and $14.

In summary, the buy entry is $14~$15, if the price not back down to $14~$15, the buyer can chase. The upside target is around is gap fill at $23 at least.
The third one is ZIOP: a synthetic immuno-oncology company.
- both monthly and daily price break out
- both daily and monthly short term MAs act as supports, very strong support
- all technical indicators run positively


In summary, buy breakout above $8 or support at $7, actually just buy it at current level, this guy will run much higher. The upside target is around $11
Note: my personal opinion is not for investment purpose, but for education and illustration
Saturday, April 8, 2017
4/8/2017: E-mini sp500 volume profile analysis

First look at the daily volume profile from 1 hour chart.
- last Wednesday, ES range from 2343.75 to 2375.25, a P shape profile with a long tail, the most transactions happened from value low to value high [2359, 2375].
- the following Thursday, ES runs a D shape profile range [2345,2361.25], fill the long tail of Wednesday
- Friday ES did almost exact same thing as Thursday
- So in short term support still 2340, Resistance 2360
Next look at the weekly volume profile from 1 hour chart.

- the passing week whole value area still is overlapping with last last week's one.
- close around weekly's VPOC 2354. value area [2345, 2360
- basically this passing week's b shape volume is backing filling last last week's B/P shape volume, nothing really bearish or bullish just from this profile
In summary, ES has already retaken 2340, if not losing it again, the upside movement has higher probability
4/8/2017 sp500 miniature wave structure analysis

The most concern for every investor or trader is what direction and where the market will go next several days or weeks.
- long term still bull market, all monthly, weekly, relatively longer term daily MAs are all moving up firmly
- only concern is the short term market direction and where to stop the current weakness
- after market hit 2400 (wave 5-3-3), if this down wave 5-3-4 has been already finished or not is still in question
- the probability is go with wave 5-3-4 not done yet (VIX future is in contango, potential shoot up)
- line in the sand is bull defending line 2340
- even the wave 5-3-4 not done yet, where will it make a stop: most probably double bottom: 2322, or 2300
My personal opinion is not for investment purpose, but for education and illustartion
Subscribe to:
Posts (Atom)