Tuesday, January 31, 2017

1/31/2017: market update

First let's take a look at sp500 index which is most people focus on. Today the price hovered around in the price low range 2267~2270 most time. After 11:00 am (pacific time), the buyers stepped into the market and pushed up the price to 2278.87.  The close is pretty strong. The upside follow through will happen in next trading session mostly. The price still holds up in a uptrend channel in 1 hour chart. The possible movement path:

  • Move up to 2294.63 gap fill and continue up for break out attempt
  • Move up to 2294.63 gap fill and reverse the course immediately to try the channel lower bound.

The sp500 daily sell signal is still valid. Like mentioned yesterday, the short opportunity should be the gap fill 2294,63 fill and reversal. However, the low possibility thing could happen that the price break out 2300. The short stop is needed too.

The Nasdaq is in a rising wedge. It will probably act same behavior as sp500 in next trading session.  The gap fill 5660 will be watched. After the gap fill the directional move will be unfolded. 

Monday, January 30, 2017

1/30/2017: sp500 daily update

Today's price action showed sp500 bullish percentage index crossed down its own EMA 20. It is a sell signal. However, it does not mean there is no price rebound after this sell signal. The sell signal only means the trend start to go side way and drift down. The same sell signal happened on AAII sentiment indicator: the bull vs bear. These 2 signals lined up together now. And this signal pattern showed up in last Sep. pull back too. How to use this signal? This is a short term trading signal, not a day trading signal. The strategy is take profit or short the rip. In case the index break out 2300, the stop still need to be put in.   


Sunday, January 29, 2017

1/28/2017: E-mini sp500, T-bond future update

The E-mini sp500 hourly market profile is shown below. The profile only showed the regular hour transactions. The gap fill around 2280 is just matter of time. The bull should protect that gap for the first try by bear. So as a buyer buying that dip has very high probability to make profit to target 2295. The seller can short around 2295 to make profit to target around 2280. Last Friday's VPOC and Wednesday's VPOC are all around 2290, so 2290 is  good control point to watch, above it still to 2295, if below it, 2280 still is the target. Also please use daily pivots level to prepare your trade.    


US T-bond futures (ZB) hourlt market profile is shown below. The profile is for regular hour trading only. The value low/high and VPOC of last Friday trading session are all above last Thursday's trading range. If next week the price can take over 1/20/2017 and 1/19/2017: these 2 days' VPOC 150'14 and 150'21, the short term trend may reverse up. The gap fill 150'17 will be filled. And upsdie target can move to 151'20 area.However, if break down last Thursday's VPOC 149'20 area, it will retest low 148'31.


1/28/2017: new sp500 near term target update and all indices short term update

The 2017 new year rally indicates the wave 5-3-4 was finished at 2233.62. Now we are on the path of wave 5-3-5. Since the Elliott wave theory does not give the constrain or limitation on wave 5. So the wave 5 usually is hard to estimate. What I am doing here is to use equal wave length to estimate this wave 5 target.

  • If this wave 5 length equals to wave 1 from 2083.79 to 2182.2,  then wave 5 target is 2332.13
  • If this wave 5 length equals to wave 3 from 2151.2 to 2277.53, then wave 5 target is 2359.95.


However, I am sure lots of folks are more interested in what can we do in the middle of this path for wave 5. Everyone mostly has concern if this 2300 mark can trigger big pullback or sell off.  My personal opinion is the big sell off is not guaranteed and upside target is still guaranteed. There are 20 points for each ladder: 2240, 2260, 2280, and every dips around 5~6 points below the integer mark(2233, 2254). 
  • So this pull back from 2300.99,  at the dips around 2275 will be bought up again to the wave 5 target. 
  • the pull back stop at the break out top trend line then bounce up again to the wave 5 target.

The update of Nasdaq for short term trading is following. Nasdaq is the strongest one within recent rally. Breaking out the ascending wedge make the 2 trend lines of ascending wedge act as support. if these 2 trend lines do not hold, the gap fill at 5600 is another support. And final near term support at 5560 I believe is a strongest one which is not breakable before April. 

The update of Dow for short term is following. After Dow take over 20000 high land, a little bit gave back happened within last 2 trading sessions. It is still in consolidation mode. The top trend line which was broken out now acts as the support. The gap at 19950 also act a good support.  The psychological meaning of 20000 may not actually act as a important market indication. 

Friday, January 27, 2017

1/26/2017 sp500 update

Today is the second day of market break out. Today's candle stick looks like a doji and inside day bar (the high is a little bit higher than yesterday's high and the candle has a very very small body). It is a consolidation day, neither a uptrend follow through day, nor a trend reversal down day. What will be the developments of the market for next several days or weeks. The market is very tricky now. Nothing really match together to be able to confirm the forecast the next market action. Today I will show you what I found: the match up between certain pattern of technical indicators and market next action. The bollingar band expansion together with MACD gold/death cross have good indication of the market trend movement. The brexit market trend reversal has this character. The election market trend reversal has same character. The last Aug trend reversal also has the same character. The question is at current phase: what is next? (market sit high with lots of different technical indicators not line up with each other). Right now, the BB start expand and move  up above its 10 days EMA and the MACD happened a little bit golden cross (We need next several days's data  to confirm it). The conclusion is the uptrend continuation need more buying power to keep the MACD in golden cross state, thus we can keep the BB expansion and MACD cross up in harmonic.  

Monday, January 23, 2017

1/23/2017: sp500 update

The market still keep one day up , then one day down pattern. Without further catalyst, the market may still keep this pattern. However, today there is certain technical indicator deteriorate further rather than improving.

  1. The bullish percentage index are slowly moving down still above its own 20 days MA. 
  2. The AAII sentiments (bull-bear) still manage above 0, but with much less value. 
  3. The ROC cross down its own 20 days EMA and slightly below 0.

The negative ROC with negative MACD and PMO together will bother the market's bulls. Unless some of these indicators can reverse back up soon, the market indeed is in downward trouble. So the strategy is till short the rip better than buy the dip although 2 approaches are mostly still working in a short while. 


For DT, please still use following short term chart as reference.

1/23/2017: some stocks update

The first stock is uranium play: global X Uranium ETF (URA). The stock price rip on a tear, it almost touch the $17.1 level recent high again. The daily RSI showed overbought. Othe technical indicators are still positive. If it pull back, the buy level is around $14.5 (first down gap area), other 2 gaps below: $13.7 and $13.25 can be buy points too. If it breaks out, by looking into the weekly chart, we can see the level $20 is a valid resistance. The possible price path is labeled in the weekly chart.
The 2nd stock is a generic drug company Endo Pharmaceuticals (ENDP). The weekly chart showed RSI bottom divergence. It is positive sign that this stock will move up. So far the price still runs inside a falling wedge unless it can break out the wedge before running into the end of wedge. The optimal buy entry is the end of falling wedge, if break out earlier, have to chase. Upside target is $25.
The 3rd one is ACIA. The stock price recently is quite positive. It is ready to challenge the upsdie 50 days MA around $67.

The 4th one is Nuance Cimmunications (NUAN). Positive stock price action recently put multiple short term MAs underneath as support. 50 days MA is ready to cross up 200 days MA, upside target is around $17~$17.5.
The 5th is Teva Pharmaceuticals (TEVA). The stock price is in down trend for a long while, kind of depressing. However, sometimes depressing price may give buyers a good deal for long term hold. The price just sit on the monthly multiple support around level 31~33.  The monthly RSI showed extremely over sold. If it hold level 31~33, it will back up; if not, next level support is 25. The patient stock holder can take average down approach to get in some at $31~33, and some at $25 (if break down current level).
http://schrts.co/u6mdJr

The sixth one is SRPT. I have played this stock in last December. The run was from below $30 to $38. Now the price back down. The price is close to the support level around $28.8 again. This level should be watched for rebound. Note: the comments on the chart is still from last December. 
http://schrts.co/jzZv61
The last one is popular BABA. The price action is pretty positive recently. The bias is still going up if there is no earning report immediately. The earning sometimes is disruptive and unpredictable. So the short term upside target is based on no earning's disturbance. 

In summary, I have not make any decision to get in either one of these stocks. The analysis is for the evaluation purpose.

Saturday, January 21, 2017

1/21/2017: potential earning play and long term play (multiple stocks)

The financial sector shot up since president election. Although recently there is some pull back within financial sector, the insurance companies hold up much better. One of them is Metlife (MET). Its earning comes up on 2/2/2017. Here I am discussing the possible earnings play and the long term play on Metlife's stock.  First let's look at its daily chart. The bollingar band width is extremely narrow, Since last June, we have not seen this narrow band. The coming 2/2/2017 earning will trigger a big move. Although the narrow BB's causal big move has no direction indication, based on current fundamental positives for financial sector, I believe the big move is biased to be up.    

Second, let's look at the monthly chart. The long term multiple year's resistance around 56.6~57.5 is inches away from current price: $54.33. The stock price runs in a big ascending triangle. All the monthly MAs underneath act as big and strong support. The break out is just matter of time. 
Now, let's see how to invest in long term or play short term earning. Can this earning really make the break out happen? Nobody really knows. If the bets are not expensive, earning play always can play at small odds and small cost with big pay out. Following is the plan:
  1. long 2/17/2017 57.5 call with $0.41/contract(1/20/2017 market close quote). The Implied volatility (IV) of 2/17/2017 $57.5 call is only 24.18%. The very low IV means that nobody really expect that big move with post-earning move.  Will the price surprise everyone after ER? Wait and see.
  2. long 2/17/2017 57.5~60 call spread with $0.27/contract premium. This will lower the cost substantially. If I bet $300, the potential gain could be $2000 if price close above $60 after 2/17//2017 close. Although the odds is very low, but the pay out is very high(around 6 folds). It may be worth to try.
  3. The long term play, the break out is just matter of time. The upside target is at least around $65~$70. Long leaps call June/2017 $40 call, assume you paid $15/contract, when it hit target $65, you still have around 66% gain.
  4. Definitely someone who prefer to use sell put to scoop up the share want to sell 2/17/2017 50 put, however, the IV is so low(only $0.38/contract premium), sell side is not good choice.
In summary, an investor should look at long term strategy; a market player can take a look at short term earning play. 

One more pick is CREE: a very volatile earning play. The daily chart showed again a BB extreme contraction pattern just before ER. The big move mostly will be triggered by ER. Last 2 ERs CREE both made $4 down move, if history repeat , I believe the $4 move for this ER too. CREE ER date is 1/24. The 1/27 $28 straddle now only worth $2.5/contract by last Friday's close. So next Monday (1/23/2017) if the straddle trade still can get $2.5~2.7$/contract, it is worth to try. Even post-ER cree made less than $4 move, this straddle trade still have very high probability to make break even.

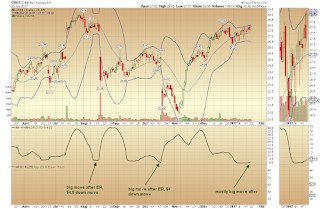
http://schrts.co/6EmLiG
Another pick is AKS Steel holdings (AKS). Its earning date is before 1/24/2017 open. So if we want to make a ER trade, we better make a trade on 1/23/2017. Let's take a look the monthly chart of AKS. The long term resistance (15 year's resiatnce from 2012 to now) is around 11.3, the current price at $9.52 which is not far away from the resistance line. Some characters are listed below:
  1. there are certain traders like to place the call option right on the break out level. Why? 
    • it is cheap OTM option (worth to bet)
    • when price break out, it run away fast, pay out ratio high                                                    
       2. The daily chart BB is ready to expand with earning. Although there is no clear direction                       indication, my experience tells me the BB expansion usually follow a pre-ER run down. (it                 happens on amazon, google etc big momentum stocks too) . I c all it deceitful run, the stock                 price runs down to lower BB, then reverse back up to expand upper BB.

The trade idea is buy March 17, 2017 $11 call, right now only $0.45/contract, if AKS price shoot up after ER, the post-ER drift will help the stock price break out $11.3 level to go much higher, potentially to $15.

Always, remember the option buying risk. If you do not understand the risk, please no follow the trade. 


1/21/2017: several long term high potential-high risk picks

I recently start a new method which use accumulation/distribution extreme to detect certain stock bottom out. This method has not been fool proved yet. The following stocks fall into this category. I have small positions in each of them. I am expecting them to have 50%~multiples gain within one or two years. But I am sure some may not come to the expectation. I will periodically check their performance and make some adjustment.

Column1 Column2 Column3 Column4 Column5
Date bought price bought Date update price update
AG 1/20/17 $9.10
CYH 1/20/17 $6.60
ERIC 1/20/17 $5.80
GLUU 1/20/17 $2.30
NOK 1/20/17 $4.76
SPWR 1/20/17 $6.90
WFT 1/20/17 $5.40
  
In summary, GLUU and SPWR so far yearly cash flows are negative, there may be a concern about the company's survival. Others' cash flow looks fine. This is the sample to test my strategy. It is a reference, no need to follow.   

Thursday, January 19, 2017

1/19/2017: netflix and lockheed martin update and recommendation of possible buy

The netflix ran out of door with gap up this morning with good earning from yesterday. It closed at $138.41 by giving back $5.05. Although the gap up got sold off a bit, I believe the price will get higher down the road after the profit-taking sell. The bollingar band started expansion and will expand much bigger. The MACD still golden cross and climbing up. Buy this break out pull back, the price will at least try today's high 143.46 in near future.
  http://schrts.co/HJjsxs
Lockheed martin price action is impressive that it bounced off from lower support trend line, break out a little from resistance trend line. It is ready to fill the gap 258.99. Then it may consolidate a little to continue the uptrend. 

1/19/2017 SP500 update

The recent market runs with a pattern: one day up, one day down. Tomorrow is Friday: the monthly option expiration day. Furthermore it is a big day for Mr. Trump: the elected president inauguration day! The days with so many events could be a volatile day. How the market is positioned to welcome the new president, same time for the monthly expiration is not a crystal ball. The OEX option chain still very bullish: PCR value is at 0.52. The equity pcr is relatively bullish too. Both charts are attached following:

All option oscillators will not give the exact market daily direction. I prefer to use use as a bottom.top indicator by extreme values. For tomorrow's market,  I made several hypothesis move based price action. By the 2-hours chart, sp500 runs within a triangle, the bottom trend line of the triangle is formed by the low of Italy referendum in last early December and the low of the end of last year profit-taking sell off. There are 2 top trend lines: one acts as the top trend line of the triangle, the other acts as the top trend line of the wedge if triangle is broken out. The downside of 2240 gap fill is a possible extreme downside target, the upside could be touch of top wedge trend line around 2285. The several possible paths are labeled in the chart. It may take days to touch either upside or downside targets.


Wednesday, January 18, 2017

1/17/2017: sp500 update in the middle of Jan

There are price and technical indicators' pattern match between Aug 2016 and Jan 2017 for sp500.

  1. Both price are consolidation in high level
  2. The BB width keeps narrow when consolidation
  3.  MACD value line cross down signal line and runs below it. 
In late Aug 2016, when BB start to expand, sp500 index start to runs down. Can it happen to Jan 2017? It is very very possible. Only one thing can save the bull is that the MACD back up to have golden cross happen. So the trading should be more short than long (high probability goes with short, lower probability to go with long). Remember another MACD golden cross strike back can still save the bull.

 http://schrts.co/33R1vG
The weekly chart showed MACD and PMO still positive trade flow. Even there is a sell off, the bigger sell off has to be come with MACD or PMO death cross on weekly chart. When the weekly sell is triggered, it does not mean there is no daily rally, it means to short the rip/rally. 

Tuesday, January 17, 2017

1/17/2017 Hot stocks update

The nvidia, nvidia, my pick in the end of 2015 and bought at $32 before CES. I was expecting a big run befoe 2016 CES, however, I got crushed by Jan 2016 stock market big correction. The price down to around $22, I still hold it and sold it around 62 in Aug 2016. But the stock surged in a tear after Aug 2016 to almost $120 in the end of 2016. I missed quite a big gain. I was partially of right and partially wrong on this monster stock. I am still looking for to get back in it, still waiting ...... The daily chart showed the support and uptrend pattern: 50 days MA, simple catch. If 50 days MA support fails, I have find new support pattern. So far I keep this pattern alive and will re-tune up based on future price action.
BTW, Nvidia was demoed first automotive application based on her GPGPU in 2010 or 2011 CES (I do not remember the exact year, I was there to see the demo).

1/17/2017: cyber security update

In the new year of 2017, the cyber security was mentioned in several occurrences: Russia hack of US election; corporate security upgrade cycle, etc. There are some expectations of cyber security sector will do well in 2017. Let's take a look this sector from long term to short term. The first one definitely will be the ETF: HACK. The monthly chart showed good consolidation above 5, 8, 13 months EMA, ready to break out to run higher.
The weekly charts showed the price in a ascending triangle. It is also ready to break out the resistance level 28 to run higher.
The daily chart shows where to get in the ETF. 
The next one is the one of leaders: palo alto network (PANW). The daily chart gives out short term resistances and possible running path. The 200 days MA is imminent resistance, if take it out, next target is $145, then $150.  If the price back down from from 200 days MA, it will look for lower price to get support first, $132.5 level is short term MAs confluence, it may get support there. 
Another good one is CYBR. The daily price is in a big wedge with several level supports. The first support is around 49, second support is around 45~46 which I believe it is the best buy entry. 
The last one is CUDA. The price runs down today with broken down most short term MAs. The lower price is down the road. It may get support on the conjunction of uptrend trendline and privious breaking out trendline. 
In summary, the cyber security sector is good to pick for 2017. The most stocks are high and be ready for more price correction. Getting in with a good entry is the focus of this post. 

Monday, January 16, 2017

1/16/2017 SP500 update

The overall market is still in the seesaw session by daily action. The daily chart is showed as following. The daily chart's MACD and PMO still showed negative trade flow. The RSI is neutral and ROC is still positive. The US dollar weighted volume still points up and hold up the uptrend trendline. The bullish percentage index's 20 days EMA still point up and this index does not cross down its 20 days EMA yet (No bullish percentage index short signal). The AAII sentiment showed the bull still outrun bear(No AAII sentiment short signal). So there is no new signal triggered by daily signal.
The 1 hour chart gives us more details for near term support and some pattern set up for further development. The falling expanding triangle was broke out and continuously formed a small bull flag.  Some resistances and supports are labeled  in the chart. 

1/16/2017 new stock pick

My scan system gave me several picks this weekend. I manually choose 2 to share here. The first one is Hewllet Packard Enterprise (HPE). This stock is in uptrend since spin off. The daily chart showed it still runs in a uptrend channel. And recently the price touched the lower trendline and bounced up. Although several short terms MA act as the major resistance.  I believe there is high probability that the price will break out to previous high or top trendline.
The weekly chart showed the price got supported twice on 21 weeks EMA. The price runs in a smaller down trend channel (bull flag). The break out is pending. The price is ready to move up. 
Where to buy on 1/17/2017 market open? My personal idea is to buy between 22.7~23, stop below 22.2.

The next one is a grocery store Kroger (KR). The price get supported by uptrend trendline multiple times and it broke out downtrend resistance trendline. It also break out 200 days MA. All short term MAs act as support to pop the price up. First resistance around 35, after that, the 36 level will be challenged. Step by step, it may go higher.

1/15/2017 update TLT chart and 30-year treasury yield chart

The 20-year treasury bond fund : TLT is a good investment vehicle to hedge equity long for risk off trade. Keep a eye on it and put it into the portfolio is a good idea. Especially, at the current situation of equity index hovering high, finding a good way to hedge equity long is kind of necessary. There are lots of way to hedge equity long such as long VIX related instruments: VIX call, VXX call, UVXY itself or call, etc, even the gold. Here I am not discussing the VIX related stuff and gold.

The daily charts of both TLT and $TYX (30-year treasury yield) are showed below. This 2 charts runs as a mirror image from each other (they are reverse). TLT's chart showed short term weakness and tended to move down to form the reverse head shoulder's right shoulder. TYX's chart showed short term strength and tended to move up to form the head and shoulder's right shoulder. So the trading plan is to wait for TLT pull back to  around 118.8 level to get support and reverse the course,  then pull the trigger to long. The upside target is the gap fill around 129.

In summary, when there is a trading plan, you always wait for the setup, do not front-run the market. Buying TLT here, you may not lose money in long term, but it is not a good setup yet. Furthermore, TLT and TYX setups are helping T-bond future traders.   

Sunday, January 15, 2017

1/15/2017 shanghai composite index update

Upon the request from friend, I make following analysis on Shanghai composite index. This big index enjoyed several big swings within last 12 years. This kind of swig usually behaves like a pendulum.   Let's take a look the monthly charts. The index topped out in last 2007 around 6124.04, then it takes about 6 and half years to consolidate, finally relaunch in early 2014. The recent top happened at the middle of 2015, then the correction started almost the same pattern like top out in 2007. Right now, it runs within a big wedge. How long it will take to finish the correction: 6 and half year? It is hard to predict. But I believe the market will hit the lower bound of the big wedge, then relaunch again. If the lower bound of big wedge is broken  down, it is really a big big bear market which I think is a low probability outcome. Regard to the short term direction and trend, I have to look at the weekly or daily chart to derive some clues.

By examining the weekly chart, it is relatively easy to derive the potential short term bottom: it should be 50 weeks moving average since this MA acted multiple times resistance in late 2015. The bounce will happen around 50 weeks MA. In case 50 weeks MA does not hold, the 200 weeks will still act as strong support since this MA acted as supports twice in early 2016. If this 200 weeks MA not hold, next target will be the lower bound of the big wedge showed in monthly chart.
  
In summary, except this index can reclaim EMA 13 days around 3134, the downside to come is most high probability outcome. 50 weeks, 200 weeks 2 important levels to watch. The final bottom to keep the bull hope is the lower bound of big wedge on monthly chart. Let's still keep the bull hope.

Saturday, January 14, 2017

1/14/2017 weekend several biotechs update

Although these following biotech stocks are not in my portfolios yet(some were in my portfolios before, but not now, since I am changing to invest/trade more on ETfs), they are pretty popular in the investment community. I am not very familiar with fundamentals of these biotech companies. Here I am concentrating on the technical outlook. First let's look at Lexicon Pharmaceuticals (LXRX). Both daily chart and weekly are posted following. Daily charts showed very positive trading flow. All technical indicators point up. Short term price is expected to go up. The top trend line should be challenged.  Weekly chart is still neutral. Next several weeks or months, the price mostly runs within a big triangle. There will be a break out or break down next several months. My personal bias is break out. However, the break down case is prepared for strong strong buy.
Second, let's take a look at Bellicum Pharmaceuticals (BLCM). Within technical indicators: MACD is positive, CCI runs from botom up. RSI slowly moves up(most technical indicators are positive). The only negative thing is all short term MAs point down. So next several days' price action is important, if price move up from here. All short term MAs will revers up to turn into support.Level strong support is at around 13, level strong resistance is at around 16, short term price may runs between these 2 levels until a break out/down. My personal opinions is relatively neutral. 
  
Last one is Array Biopharma (ARRY). The weekly showed as following. The stock price enjoyed a monster run recently. The long term top break out is huge for potentially much higher price. The measured move target is 8.5-2.5+8.5= 14.5. As long as 8.5 strong support hold, upside target is still possible. So buy level is around 8.5. break back down 8.5, long should bail out, and no immediate buy.
In summary, the individual biotech stock is very volatile due to the trial data or FDA news, etc. The technical analysis is helping to identify where the stock could be a buy entry or a sell target. Investing in a biotech stock should keep right size of position and right time frame to hold. Personally, I may like to trade/hold LXRX, trade ARRY only within these 3.