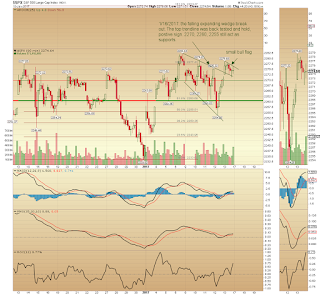
The 1 hour chart gives us more details for near term support and some pattern set up for further development. The falling expanding triangle was broke out and continuously formed a small bull flag. Some resistances and supports are labeled in the chart.
Monday, January 16, 2017
1/16/2017 SP500 update
The overall market is still in the seesaw session by daily action. The daily chart is showed as following. The daily chart's MACD and PMO still showed negative trade flow. The RSI is neutral and ROC is still positive. The US dollar weighted volume still points up and hold up the uptrend trendline. The bullish percentage index's 20 days EMA still point up and this index does not cross down its 20 days EMA yet (No bullish percentage index short signal). The AAII sentiment showed the bull still outrun bear(No AAII sentiment short signal). So there is no new signal triggered by daily signal.
Subscribe to:
Post Comments (Atom)


No comments:
Post a Comment