Right now this post is only a place holder for access privilege test.
Right now this post is only a place holder for access privilege test.
Right now this post is only a place holder for access privilege test.
Right now this post is only a place holder for access privilege test.
Right now this post is only a place holder for access privilege test.
Right now this post is only a place holder for access privilege test.
Sunday, June 25, 2017
Sunday, June 18, 2017
6/18/2017 stock picks (semiconductors)
Recent Nasdaq pullback really put semiconductors in a spot that we need pay attention to have positions in this sector. Several small caps are scanned out by my system.
1. MKSI:


1. MKSI:
- fundamentals: major customers are lam research and applied materials. These 2 companies are hot leading semiconductors in the sector. So buying MKSI has similar buying action on LRCX and AMAT
- technically on trend line support

2. ACLS:
- fundamentals: first quarter of 2017 revenue growth almost double of applied materials and lam research
- technically back above trend line, short terms MAs point up

In summary, these 2 picks are long term player. I do not recommend to put stop in.
Note: my personal opinion is not for investment purpose, but for education and illustration.
Monday, May 29, 2017
5/29/2017 sp500 breadth analysis
After briefly market comes to new high, sp500 has already inked 7 consecutively up days. Everyone is concerned about how the market will develop in next several trading sessions. The breadth analysis is following:
1. The percentage of sp500 stocks above 50 days MA. The reason of not using 200 days MA or 100 days MA is that the index still above 50 days MA, no need worry about 100 days MA or 200 days MA for now.


1. The percentage of sp500 stocks above 50 days MA. The reason of not using 200 days MA or 100 days MA is that the index still above 50 days MA, no need worry about 100 days MA or 200 days MA for now.

2. breadth momentum oscillator which can confirm the current sp500 breadth.

In summary, the breadth momentum oscillator confirmed the current index breadth is improving and will be improved further. It is a very positive sign for the bull. The pull back will happen, but it will be manageable and small. Buy dip is the best deal still.
My personal opinion is not for investment, but for education and illustration.
Sunday, May 28, 2017
5/28/2017 some stocks update
The update in this blog includes: Amazon, Google, Avago.
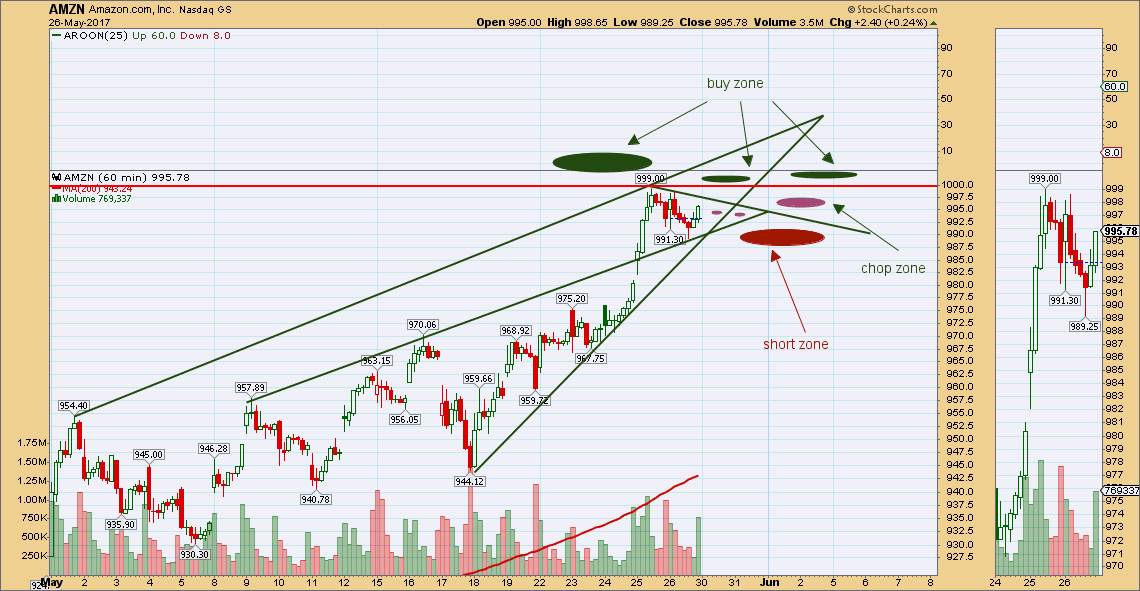
1. Amazon:


1. Amazon:
2. Google:

3. Avago:

In summary, all buying and selling/shorting zones are labeled on the chart.
- buying: buy dip
- selling/shorting: sell the rip
My personal opinion is not for investment, but for education and illustration.
Sunday, May 21, 2017
5/21/2017 what to buy/hold if market roll down
Some analysis about what to hold/buy if market start to roll down is discussed here.


- Transportation ETF: IYT

2. financial ETF: XLF

My personal opinion is not for investment purpose, but for education and illustration.
Saturday, May 20, 2017
5/20/2017 SP500 wave structure analysis
Since the index hit 2352.72 on 5/18/2017, it reverse up to 2389.06 before around 8 points pullback. There are 2 wave counts possible for the index.
The first is bull wave count. Please refer to 4/301/2017 blog that the reverse head and shoulder pattern still is valid.
http://faithwithseedbest.blogspot.com/2017/04/4302017-sp500-wave-structure-analysis.html

 http://schrts.co/hb2qpF
The first is bull wave count. Please refer to 4/301/2017 blog that the reverse head and shoulder pattern still is valid.
http://faithwithseedbest.blogspot.com/2017/04/4302017-sp500-wave-structure-analysis.html

- wave 5-3-5-1: 2405.77
- wave 5-3-5-2: 2352.72
- wave 5-3-5-3: target 2438 (wait and see if it can break out 2406)
- wave 5-3-5-4: wait for where wave 5-3-5-3 stop.
The second is bear wave count.

- wave 5-3-4-a: 2322.25
- wave 5-3-4-b: 2405.77
- wave 5-3-4-c:
- first possible target: 2320
- second possible target: 2300
- third possible target: 2285
After wave 5-3-4, then wave 5-3-5 will start.
How to tell it will evolve into a bull or bear path: watch the recent low 2352.72, if not break this support, the bull path still is valid.
How to tell it will evolve into a bull or bear path: watch the recent low 2352.72, if not break this support, the bull path still is valid.
My personal opinion is not for investment purpose, but for education and illustration.
Sunday, May 14, 2017
5/14/2017: sp500 analysis and possible path
It has been a while that the sp500 index consolidate below 2400 and above 2380. It is time to make some resolution to resolve the market move? Following is the analysis of some important levels to watch and measured moves for target hit. The corresponding possible path is posted.


- small consolidation box [2380, 2400], upside measured move: 2420, downside measured move 2360 (match the big consolidation box's middle line)
- big consolidation box [2420, 2400], upside measured move 2480, middle line at 2360
- bottom support arc drawn on the chart
- path: honor the bottom support arc up to 2420-> 2400-> 2480
- path: break down box [2380,2400] and the support arc and move down to 2360, then reverse the course, ->2360->2420->2400->2480
If the index break down 2360, the path will be totally different and is not discussed here so far. Currently I am still maintain my bullish view as it is.
My person opinion is not for investment purpose, but for education and illustration.
Subscribe to:
Posts (Atom)