Sunday, February 26, 2017

2/26/2017: daily stock pick Nordstrom (JWN)

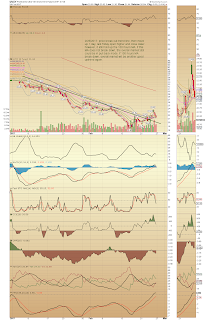
Today's one of my system pick is Nordstrom (JWN). Followings are some technical characters:


  • RSI move up and point up
  • MACD and PMO still golden cross up
  • BB squeezed so much that ready for expansion
  • price box [41,46] ready to break out
  • price right under 50 days MA and get retrace back from 200 days MA last Friday (2/24/2017)


In summary, most technical indicators point to the stock price will shoot up. However, the 50 days MA and 200 days MA are still resistance. Is this a concern? My personal opinion is "the 50 days and 200 days MA resistances are a take away , a contrarian signal". How to handle this trade? 

  • Buy after break out 50 days and 200 days MA, then next is the upside target: gap fill around $55. 
  • Buy between 45~46, wait for break out, stop below 42. upside target same around gap fill $55.
My personal opinion is not for investment purpose, it is only for education and illustration.

Saturday, February 25, 2017

2/25/2017: using VIX related instrument to evaluate the market possible move

UVXY is short term future ETF which can measure the current market's volatility. Sinbce 2/15, UVXY and overall market both climbs up. On 2/22, the sp500 spent a weak trading session. On 2/23, the  sp500 initially had a good sell off, then recover most of them. Last Friday, sp500 open lower and close higher. Following are some technical characters of UVXY:


  • break out down trend trendline, so price enjoyed 2 days move up
  • Last Friday's close right on 100 hours MA


From bigger time frame daily chart, we can have some clues for trading strategy.


  • last September market big pull back UVXY high at 50 days MA
  • last November market big pull back UVXY high at 55 days EMA
  • sp500 make lower low from September to Nov, UVXY made lower high.


What we can get from UVXY daily chart is that UVXY is momentum play, not a hold play. furthermore, UVXY higher high to lower high: (130 to 104.2) down 19.2% and sp500 from high to low: (2187.87 to 2083.79) down 4.76%. So should we worry about UVXY shoot up for an equity buyer? The answer is No. Short UVXY around 50 days MA/55 days EMA has much higher gain than holding a long equity loss.

The short term overall market direction is the most concern for every investor or trader since the index come to a historical high. My personal opinion is that if UVXY can hold 100 hours MA, the overall market has much higher probability to pull back. However, if UVXY break down 100 hours MA, the overall market will enjoy another move up to new high.  

My personal opinion is not for any investment purpose, it is for education and illustration.

Thursday, February 23, 2017

2/23/2017: retail ETF (XRT) update

Retail ETF XRT got hammered today. Lots of people who owned shares asked for my opinion. I have a position with OTM June $50 call at $0.12 per contract. (a small bet, either big win or a negligible loss) . Let's look at some technical characters:


  • The monthly chart is always used for my favorite long term bet because long term decision need long term trend follower
  • price hold up 50 months MA since Jan 2016 until now. This long term MA get very crucial now. If at the end of this Feb, price cannot hold up, it is indeed a big trouble for this popular ETF.
  • the monthly chart also forms a big triangle, break down or beak out
  • the monthly chart also forms a smaller bull flag (too small, I did not draw it) 


So what is the take? My personal opinion is that since 2016 this important 50 months MA touched so many times and held up, this time it should hold up again. The reason is simple, the overall big market is still in a bull run market, this particular ETF should not be left out. Again, my personal opinion should not be an advice for any investment purpose. 

Wednesday, February 22, 2017

2/22/2017: material ETF (XLB) update

The XLB has quite some weighting on chemicals such as DuPon or Dow chemicals who made break out recently. This ETF should be watched for break run also.


  • chart shape looks like a bowl 
  • CCI turn around up
  • RSI climbs higher


As long as price hold up $51, the short term uptrend is still. Buy entry around 52 is a good deal, the upside target is around 55.

2/22/2017: oil ETF (XOP) and stock ATVI update

Although the crude perform pretty decently, the oil exploration and production ETF (XOP) does not perform well. The technical characters are following:


  • MACD down cross
  • RSI roll over, pointing down
  • price in a down channel
The weak price action and weak technical indicators mean the short term price should go down more. Where will the price stop the bleeding? The most probably level is the confluence between 200 days MA (50 week MA) and the down channel lower bound. If price can bounce from there, the stock may resume another uptrend. the buy level is around the confluence between 200 days MA and down channel lower bound.

The update of stock ATVI is  following:

  • RSI a little bit overbought
  • price level is 45.5 is resistance, if take out 45.5 ,it will challenge the high again
  • if level support 44.5 is not hold, the price may retrace to level 43, if 43 not hold, 40.5 is next support

In summary, any support level get hold, it can be a buy level, the fundamental of the stock is good, buy dip is the strategy.

2/22/2017: sp500 key levels update

A series of important levels to watch for trading decision(especially for the downside trade).


  • current high: 2366.71
  • recent consolidation low: 2358
  • last gap start level: 2355
  • last gap up gap level: 2351.22
  • last consolidation low: 2339.5
  • The 2/13 consolidation box high: 2330.5, box low: 2321.5
  • 2/13 gap up gap level: 2316
  • 2/10 gap up gap level: 2307
  • break out level: 2300.99


All these levels are key levels for the downside trade. Following are some examples:

  • if price break down 2358, it will go to 2355, if break down 2355, it will go to 2351.22
  • if price break out 2366.71, the measured move will be 2374.71
Remember all levels now act as supports, later can act as resistances if price below them. If any support gets hold up, it can be a buy level for upside trade; if any resistance gets hold up, it can be a short level for downside trade. 

Tuesday, February 21, 2017

2/21/2017: sp500 update

Since 2315 gap up, sp500 had already run up to 2351.16 with 36.16 points gain. The long weekend E-mini sp500 was climbing higher with low volume squeeze up (now in 2153 area). It looks like sp500 will make another gap up this morning (2/21/2017).


  • The technical indicators still look strong
  • No sell or short signal still by daily signal.
  • watch for [2339,2340] area support, if this area no hold, it opens up down side momentum to 2330, and further down to gap fill 2315
  • The upside watch for 2350 break out with 10 points measured move to 2360.
  • The trading range most probably will be [2340, 2360].