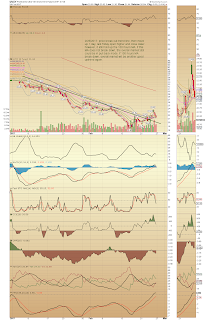
- break out down trend trendline, so price enjoyed 2 days move up
- Last Friday's close right on 100 hours MA
From bigger time frame daily chart, we can have some clues for trading strategy.
- last September market big pull back UVXY high at 50 days MA
- last November market big pull back UVXY high at 55 days EMA
- sp500 make lower low from September to Nov, UVXY made lower high.
What we can get from UVXY daily chart is that UVXY is momentum play, not a hold play. furthermore, UVXY higher high to lower high: (130 to 104.2) down 19.2% and sp500 from high to low: (2187.87 to 2083.79) down 4.76%. So should we worry about UVXY shoot up for an equity buyer? The answer is No. Short UVXY around 50 days MA/55 days EMA has much higher gain than holding a long equity loss.
The short term overall market direction is the most concern for every investor or trader since the index come to a historical high. My personal opinion is that if UVXY can hold 100 hours MA, the overall market has much higher probability to pull back. However, if UVXY break down 100 hours MA, the overall market will enjoy another move up to new high.
My personal opinion is not for any investment purpose, it is for education and illustration.


No comments:
Post a Comment